Last month there was a new update that has been made that provides support for drillthrough report actions in the Power BI service (Microsoft Fabric)! Those of you who are familiar with SQL Server Reporting Services (SSRS) know what a great feature this is to include in your reports to allow users to jump to another report for additional information such as detail level report and even allow the ability to pass the context (parameters) to the report.
Drillthrough was a big item that might have been a blocker for some companies preventing them from migrating from on-prem SSRS or Power BI Report Server (PBIRS) to the Power BI, well not anymore:)
So how does this work? Well very similar to how it does in SSRS/PBIRS with a slight modification that I will highlight. If you are familiar with Actions this works the same, but the “Specify a report:” and “Use these parameters to run the report:” sections have to be done manually, you are not able to use a dropdown to select the report and the parameters will not auto-populate for you.
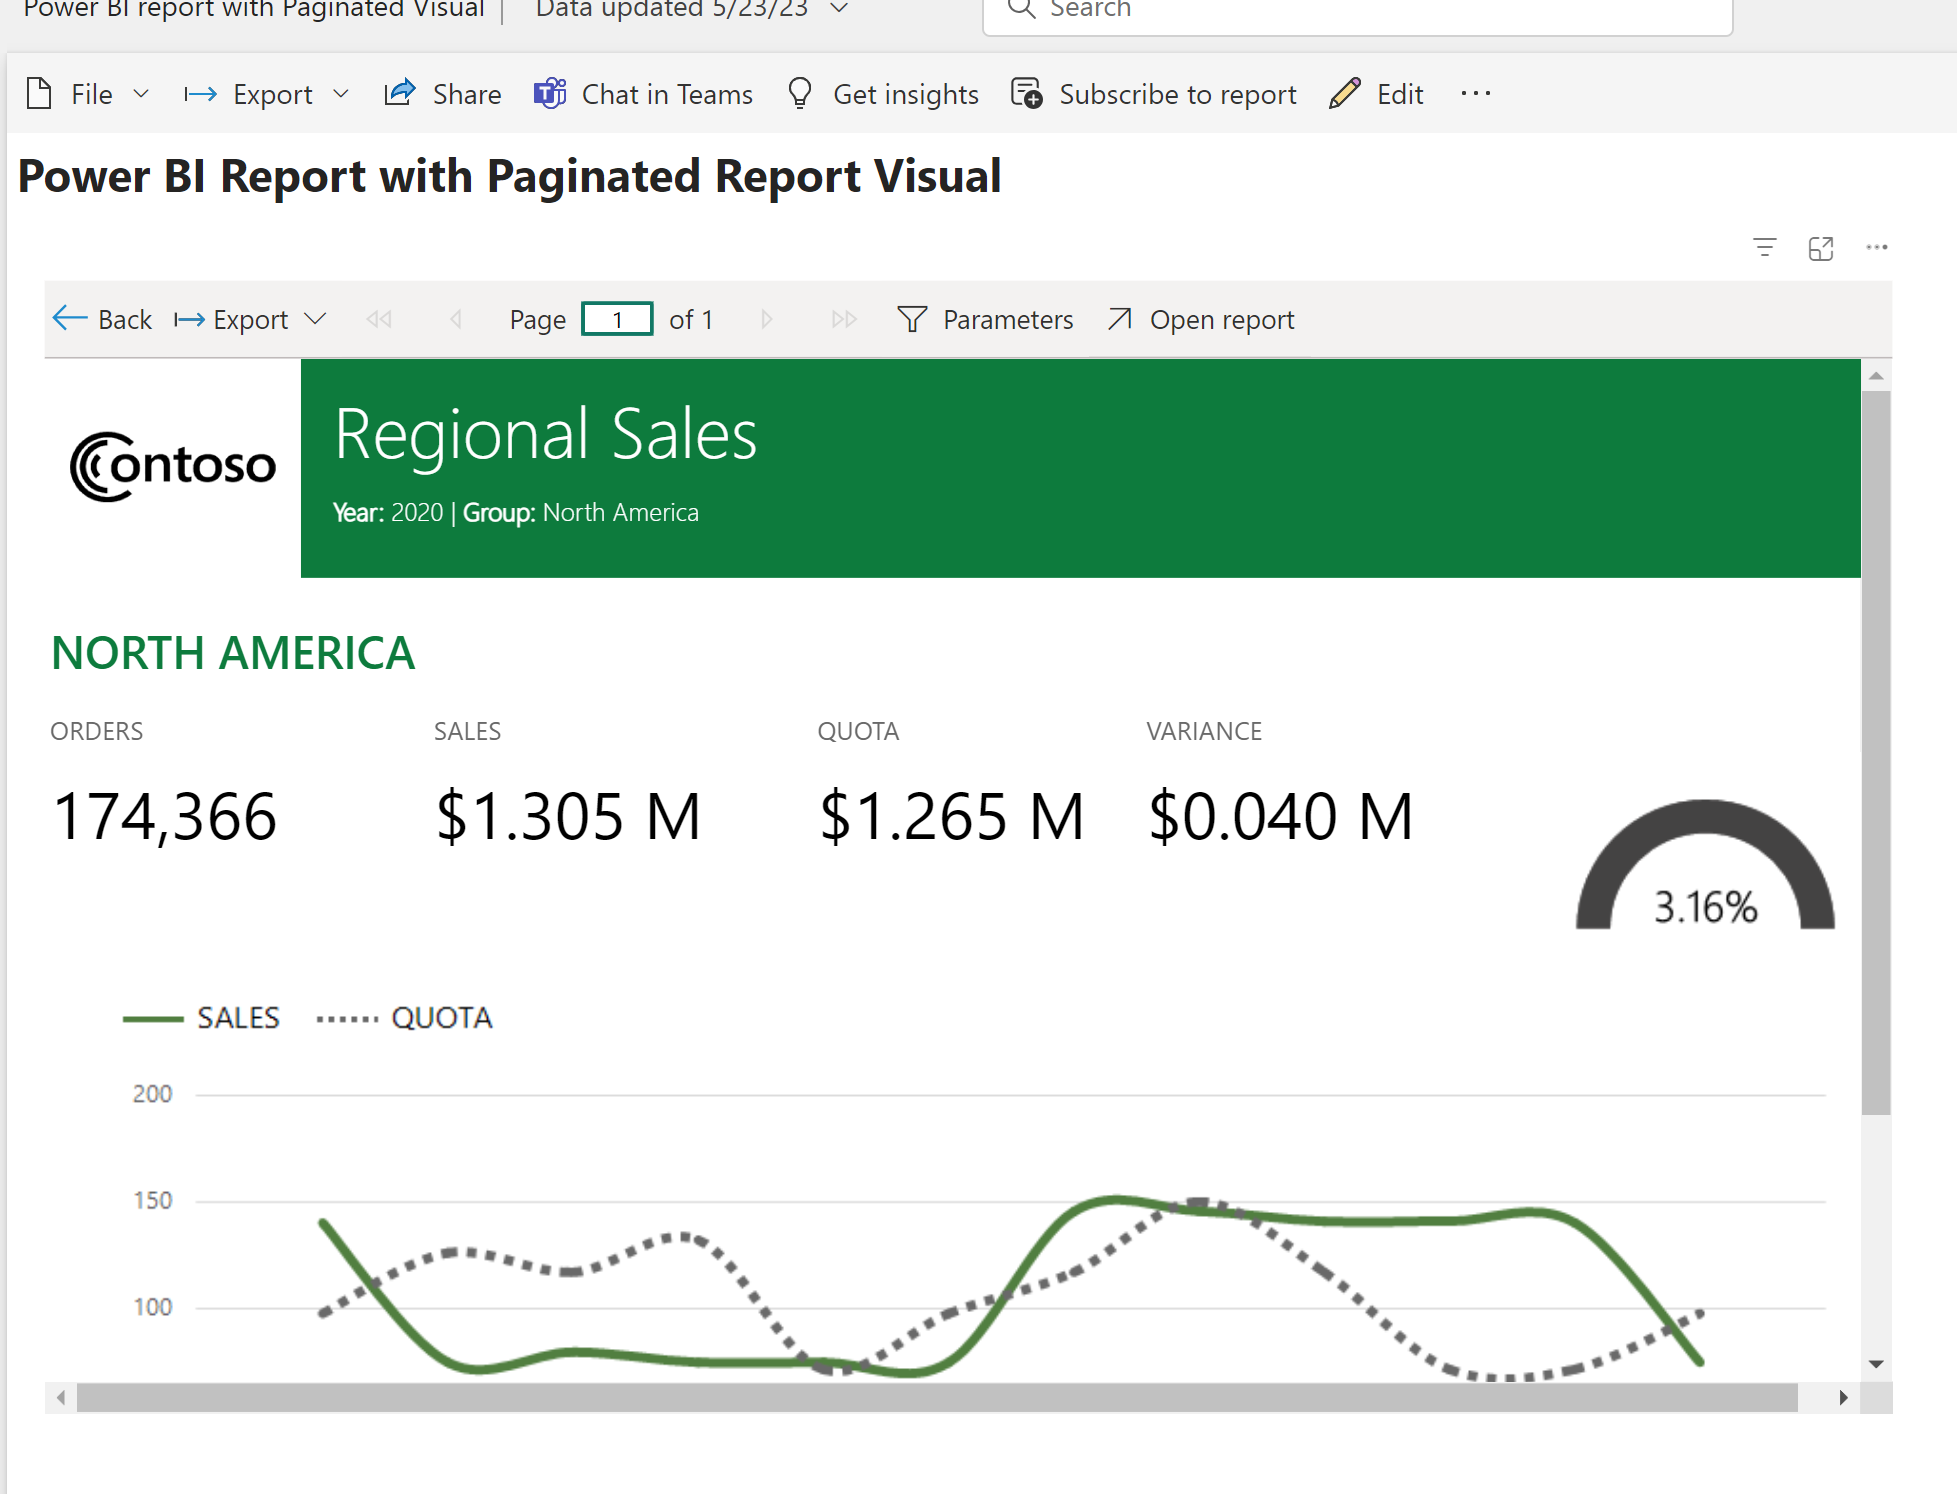
In the sample report above which I downloaded from our Paginated Report samples I updated the SalesTerritoryCountry text box on the CountrySalesPerformance report to “Go to report” (drillthough) RegionalSales. On the RegionalSales report I have two parameters, one for CalendarYear and the other for SalesTerritoryGroup.
Once this is configured you will need to publish both of the reports to the same workspace in the Power BI service and then when you hover over the text box configured with the drillthrough action you will see your icon switch over to the hand indicating that you can click on it like the following screenshot shows when I hover over “NORTH AMERICA” –
When I click on “NORTH AMERICA” then I will get sent to the report configured with the drillthrough RegionalSales and it will pass the corresponding configured parameters in the action and I get a nice little notification since this is the first time I am doing this and it has similar “<- Back” navigation like you are used to with on-prem reports as well as Power BI reports that use drillthrough.
In the toolbar you can view the parameters and see that the values were passed from the parent report, CountrySalesPerformance, and set on the RegionalSales report.
If by chance you click on an item in the parent report that passed parameter values that were not available in the child (drillthrough) report then you would see the following when I click on “PACIFIC” –>
The entire report is blank because “PACIFIC” was not a valid value in the parameter options for Sales Territory Group. So to fix this I would need to review the RegionalSales report, include that value and maybe add some additional handling of no data by setting the “NoRowsMessage” on the tablix region on the report. So now if the user clicks on this option they would see the following –
And in case you were wondering, will this work in a Power BI report within the Paginated Report visual…well it does now and that is why I delayed posting this blog by 3 weeks and have been patiently waiting and testing for this last item to be made available (see below example).
And if you were wondering about how many levels you can go with drillthrough, the answer is 4 levels as documented here where it states the following “In paginated reports, you can drill through reports down to four (4) levels of child reports.”
Another thing to be aware of is if you are using the migration process built into on-prem SSRS or PBIRS that you will no longer get the unsupported feature message (thanks to Cookie McCray for confirming this for me) and this has been removed from the unsupported features section of the FAQ documentation here now.
What do you think about this new capability? Are you excited? Will this now allow you to migrate your reports if this was one of your blockers previously? Would love to know how you are using Paginated reports in the service today and if there is anything else that might be preventing you to migrate to Power BI (Microsoft Fabric) now.
If you have existing Power BI reports using the AAS live connection you are able to use the report rebind API to point the report to use the Power BI dataset. The one thing to note as pointed out in the documentation is that as of now if you need to modify the report layout you would need to do that directly in the service. That portion of the migration process is still being worked on and hopefully should be updated to resolve the issue so that you will be able to download the redirected report from the service, modify it, and then publish the report back to the Power BI service.
In this post I want to touch on this a bit more and provide some follow up based on work that has taken place since that post on the migration rebind (redirection) process.
In my Power BI workspace I have two reports that are connected to my original AAS database used in the migration process, one is a Power BI report and the other is a Paginated (Operational) report.
If we look at the lineage view we can see that both reports are referencing Analysis Services –
I have already gone through the AAS to PBI Premium migration and moved the database from Azure Analysis Services to the Power BI Premium workspace shown above and it is named ‘AdventureWorksLTAAS’ as shown below in the screenshot.
Now what we can do is use the APIs to redirect both reports from using AAS so that they use the new Power BI dataset. Since I have to different types of reports I will be using two different APIs and we will start with the Power BI Report. To do this I will open up Windows PowerShell ISE as Administrator, login to Power BI, and then call the Report Rebind in Group API. Below is the outline of the steps to use and I included the install of the Power BI modules as well. You would need to include the values of the new dataset, workspace, and report and remove the square brackets.
#STEP 1: run PowerShell as Administrator

#STEP 2: run script if you don't have this module installed, might get prompted to install library
If (!(Get-module MicrosoftPowerBIMgmt)) {
Install-Module -Name MicrosoftPowerBIMgmt
}

#STEP 3: login to service (you will get prompted)
Login-PowerBIServiceAccount

#STEP 4: rebind report to Power BI dataset (new model)
$body = @{ "datasetId" = "[new dataset id]" }
Invoke-PowerBIRestMethod -Method Post -Url "https://api.powerbi.com/v1.0/myorg/groups/[workspace id]/reports/[report id]/Rebind" -Body ($body|ConvertTo-Json)
Once this is completed you will see that the lineage view has changed for the Power BI report so it is now referencing the Power BI dataset that was created as a result of the AAS database migration.
Now we will do a similar process with the Paginated report, but for this you need to use the Update Datasources in Group API since this is an RDL report file. Below is the code used for this in PowerShell and you would need to provide the corresponding values for the datasource name, workspace XMLA endpoint, dataset name, workspace, and report and remove the square brackets.
#STEP 1: run PowerShell as Administrator

#STEP 2: run script if you don't have this module installed, might get prompted to install library
If (!(Get-module MicrosoftPowerBIMgmt)) {
Install-Module -Name MicrosoftPowerBIMgmt
}

#STEP 3: login to service (you will get prompted)
Login-PowerBIServiceAccount

#STEP 4: rebind report datasource to Power BI dataset (new model)
$body = '{
"updateDetails":[
{
"datasourceName": "[datasource name]",
"connectionDetails": {
"server": "[workspace xmla endpoint]",
"database": "[dataset name]"
}
}
]
}'

Invoke-PowerBIRestMethod -Method Post -Url "https://api.powerbi.com/v1.0/myorg/groups/[workspace id]/reports/[report id]/Default.UpdateDatasources" -Body $body
The one thing to note about this process for the Paginated report is that the actual RDL file doesn’t get modified. So if you were to download the file or use the option in the service to “Edit in Report Builder” you would still see the AAS information. If you view the lineage though you will see that it is referencing the Power BI workspace now via the XMLA endpoint as shown below.
So an alternate option if you actually want the Paginated report file definition updated would be to use the “Edit in Report Builder” option and change the actual information or update the file that you might have in source control and simply republish.
Now the final thing I want to wrap this post up with is the issue regarding modifying the Power BI report files as I mentioned in my previous post as well as which is highlighted in the “Import Considerations” section of the AAS migration documentation.
During preview, if you use the Reports – Rebind Report Power BI REST API to create a new binding to the migrated dataset, you can’t make changes to reports in a Power BI Desktop .pbix that were previously bound to the model in Azure Analysis Services and then republish to Power BI. Report changes for a migrated dataset can be made in the Power BI service.
What you will see if you download the Power BI report file from the service, modify it, and then try to publish it back to the workspace is the following message.
This is the item that was being worked on and I am happy to announce an update is currently being deployed to resolve this. This update is in the process of being deployed to the service so it will take some time to make it available in all regions, but once it is what you will be able to do is use the “Upload” option in the workspace to get your updated file available.
There is of course still the option to simply update the files directly in the service as mentioned. The other fix that is coming and will be available in the March Power BI Desktop release is to resolve the dialog message above “Couldn’t publish to Power BI” when you publish.
With the March release you will see the following message when you publish your report that you downloaded after the report rebind and want to publish changes back to the service.
That is what we like to see:)
So I would be curious, has anyone been using the AAS to Power BI Premium migration process? If so, what has your experience been and what kind of feedback do you have? Feel free to leave a comment, I would be very curious to know more about your journey!
In the last post I went over using Power Automate to perform a data driven report subscription using a Paginated report referencing a Power BI dataset. The flow referenced an Excel file with the information to make the process data driven and generate 2000 PDF files that could then be emailed to users. In the flow the PDF files were simply placed in a OneDrive folder for testing purposes to validate the flow would run as expected and to review the metrics after the fact to evaluate the impact of running the process.
That post was the first follow up to this post where an AAS database was used to run the report bursting process. This post is the second follow up I wanted to do by replacing the Paginated report with a Power BI report to compare performance. Granted not all Paginated reports could be swapped out with a Power BI report, but in this particular case it will work fine since I am not return 100s of records and don’t require multiple pages, plus I am just producing PDF files.
The first thing I needed to do was to recreate the Paginated report to a Power BI report and I did that with Power BI Desktop referencing the Power BI dataset that was made in the previous post follow up. I won’t go into this in detail, it was simply a matter of getting a similar look to the report output and testing it out to make sure it should work for the report bursting process.
Power BI report for data driven subscription screenshot
Once this was tested and ready I cleared the filter and deployed the report to the Power BI service. The next step was to add a new column into the Excel file for the subscription process that could be used to pass the filter to the Power BI report. Steven Wise has a nice blog post that outlines this setup with using URL filters with the report subscription here Filter & Email Power BI Report pages using Power Automate & Excel. I go ahead and add a new column “URLFilter” in the Excel file and add an expression to generate the filter that will be used in the Power Automate process to filter the report based on the Company Name value which is an attribute in the Customer table.
Excel file with the URLFilter column screenshot
Steven has a reference in his blog post to how the filtering works and is used in the export process. Now that we have the report available and the Excel file updated, we just need to modify the Power Automate flow to use the “Export To File for Power BI Reports” steps instead of the Paginated Reports step.
Power Automate Export To File for Power BI Reports step screenshot
In the above screenshot you can see that I am referencing the “Export To File for Power BI Reports” step now, using the new Power BI report that was deployed to the service, and have made a reference to the URLFilter column in the “ReportLevelFilters Filter” section of the step.
Now it is time to test the updated flow and process to validate everything works and then compare the results. After the flow has run and we take a look at the PDF files in the OneDrive folder we can notice one considerable difference…
PDF files in OneDrive folder screenshot
And the difference is in the size of the file that was produced. In the first post I included a screenshot and the size of the files was around 260 KB and now they are around 30 KB which is an 88% reduction in file size. Granted the report / file being generated here is really basic, but that is a pretty significant difference and the output if we look is basically the same (I could have spent a bit more time on getting the formatting identical).
PDF file output from the Power Automate flow screenshot
And the process took around 90 minutes again to complete, so right in line with the Paginated report examples. One thing to note is that I didn’t adjust the concurrency from the 15 setting. If we take a look at the capacity metrics we see similar impact with approximately 15% with the background processes and looks a lot cleaner with just the 2000 background operations.
Capacity Metrics App screenshot during the flow process screenshot
With Power BI reports using the Export API call we should be able to do 55 concurrent report pages using the A4 SKU that I am testing with based on the documentation limits mentioned here. I did bump up the concurrency setting from 15 to 50 in the flow and it did complete in 80 minutes the 2nd time versus the 90 minutes initially, which means like 25 reports per minute instead of 22.
Overall to sum up the three different tests from this series of posts they were basically the same when it came to the following:
Duration – approximately 90 minutes for 2000 reports (PDF exports)
Capacity impact – approximately 15% on A4 (P1 equivalent) for background operations which are evaluated over a 24 hour basis
The differences comes down to the following:
AAS Database versus Power BI Dataset
Advantage to Power BI having everything hosted in the service and has more features like endorsing the dataset in the tenant, using sensitivity labels, central monitoring, etc.
More details on the feature comparison can be found here
We did notice a major difference in file size where the Power BI report PDF files were 88% smaller than the Paginated report ones
So that wraps up the data driven subscription overview and comparison, let me know what you thought in the comments and provide any feedback you have on the series of posts. Thanks!
In the last post I went over using Power Automate to perform a data driven report subscription using a Paginated report referencing an AAS database. The flow referenced an Excel file with the information to make the process data driven and generate 2000 PDF files that could then be emailed to users. In the flow the PDF files were simply placed in a OneDrive folder for testing purposes to validate the flow would run as expected and to review the metrics after the fact to evaluate the impact of running the process.
For the follow up there were two items that I wanted to compare against the original flow
Moving the AAS database being referenced to a Power BI dataset hosted in the same capacity as the Paginated report
Using a Power BI report instead of a Paginated report
In this post I will cover the first comparison. I went ahead and deployed the existing AAS model to the premium workspace being used for the report bursting test. I did this using the Visual Studio project along with the XMLA endpoint. For this to work you will need to make sure that the XMLA endpoint read/write is enabled for the capacity as well as having the XMLA endpoints enabled in the tenant-level settings which are enabled by default.
Once the settings are all enabled then you just need to get the workspace connection information to use the XMLA endpoint and then make sure your model is using compatibility level 1500 which is supported in Power BI Premium.
Visual Studio Tabular Model Compatibility Level 1500 screenshot
Then it is simply a matter of setting the server information for the deployment using the workspace connection information and deploy the model.
Visual Studio Deployment Server Information screenshot
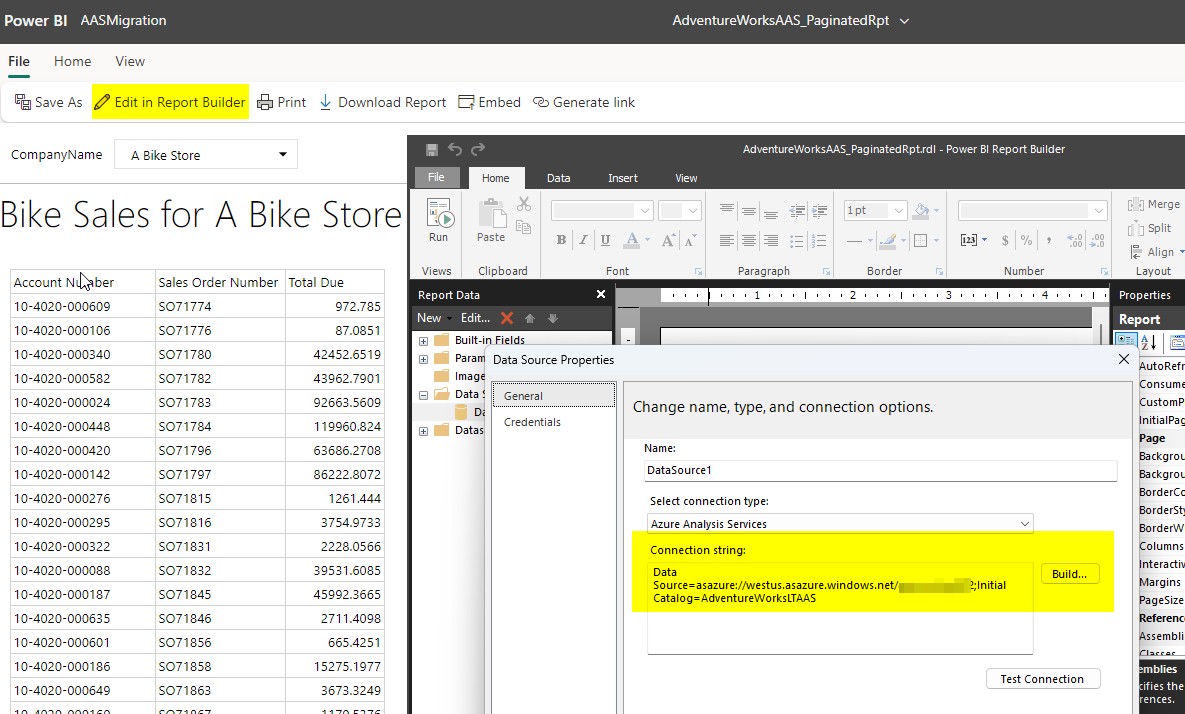
To test the Paginated report with the new model I went ahead and updated the data source connection information to reference the workspace connection instead of AAS. After you do this you will then need to switch over to the ‘Credentials’ section in the properties to enter your user name and password to authenticate.
Paginated Report Data Source connection string screenshot
Once you have authenticated you can then publish the version of the Paginated report referencing the Power BI dataset to the workspace. Now we are about ready to test the Power Automate flow with the Paginated report using the Power BI dataset, just need to update the flow to reference this version of the report which is easy to do. I would also do a quick test with the new report just to make sure it runs fine in the workspace without any issues prior to running the updated flow.
Power Automate flow with updated Paginated report reference screenshot
Once again we let the process run and it completed in approximately 90 minutes and then after reviewing the metrics app we see very similar metrics with the background operations using roughly 15% of the capacity and these operations get evaluated on a 24 hour period.
Capacity Metrics App screenshot during the flow process screenshot
So really not much different than running the process against AAS, expect now we have everything running entirely in our Power BI Premium capacity, so we can leverage all of the features like endorsing the dataset in the tenant, using sensitivity labels, central monitoring, etc.
In the next follow up post we will test out the process using a Power BI report instead of the Paginated report, so stay tuned;)
Being able to do a data driven report subscription with Power BI and Paginated reports is a common request we hear from many customers. Let’s say you want to send a PDF version of a report to each of your store or department managers using a set of parameter values specific to each person. In the Power BI service that is not an option, but using Power Automate you can do this.
In this post I will be using a Paginated report that is referencing data in an Azure Analysis Services database and I will be referencing an Excel file that I have in OneDrive for Business which includes the needed information for the data driven subscription with 2000 records. The Paginated report is in a workspace backed by a Power BI Embedded A-SKU (A4 – equivalent of a P1 SKU) for testing purposes and the AAS tier is an S1 (100 QPU).
The report for this example is basic with just a single company name parameter defined that provides a list of the customers (first and last name) and the total amount due.
Paginated report example screenshot
With Power Automate you can use the pre-built Power BI templates that are available and then customize them as needed. The end result of the flow I created looks like the following –
Power Automate flow screenshot
The trigger for this flow is just using a schedule setup with a recurrence which is part of the template. For my demo I am just running it manually to show how it works and to highlight a few options you need to be aware of. For the Excel file it looks like the screenshot below and you can see a few records have already been processed based on the Processed and ProcessedDTM columns (these values are being updated in the flow) –
Excel file referenced for data driven subscription screenshot
In the file there is a RowId column so that I have a unique key value to reference for each record which gets used in the flow to update the processed information, CompanyName column which is used to set the parameter value in the report, user information for who will be getting the report, file name and format type, and then the processed information. The processed information is so I know when the record was last sent as well as if there is a failure or for some reason need to cancel the flow I can then restart the process and it would resume with just the records that are set to ‘No’ because of the filter included in the List rows setup for the Excel file –
List rows Filter Query expression screenshot
In this example instead of emailing files to users I am simply generating the PDF files and placing them in a OneDrive folder.
Pro Tip – It is always a good idea to test your flow out to make sure it will run smoothly without any errors, determine how long the process will take to complete, and verify this will not overload the premium capacity (especially if it is being used by end users for critical reporting).
So before emailing anyone I just want to make sure the process will run from start to finish without any errors. After the process does complete I will review the metrics and determine if any adjustments should be made.
Here are screenshots of the Export to File for Paginated Reports, Create file in OneDrive, and then the two Excel Update a Row steps.
Export to File for Paginated Reports screenshot
In the Export call I am specifying the workspace and report, you could actually provide the workspace id and report id in the Excel file to make this dynamic, referencing the File Format in the Excel file for the Export Format type, and then at the bottom setting the name of the parameter in the report (CustomerCompanyName) and referencing the CompanyName provided in the Excel file.
Create file in OneDrive screenshot
For creating the file I am dynamically setting the File Name based on columns in the Excel file (make sure to also include the file extension information, seems odd, but that is needed).
Excel Update a row screenshot (set processed info)
In the first Excel Update a Row step I set the Key Column which is RowId and make reference to the RowId value currently be processed in the loop and then set the Processed column to ‘Yes’ and ProcessedDTM column to current UTC time.
Excel Update a row screenshot (reset processed column)
In the second Excel Update a Row step once all of the records have been processed in the first Apply to Each loop I simply reset the Processed column back to ‘No’ for all of the records to reset it for the next time we need to run the flow.
After all of the steps have been configured and a test run is kicked off there are a couple of things that we will see, first it reads the Excel file records extremely fast, but after further investigation on the Apply To Each step you will see that it is only loading 256 records and in the Excel CompanyList table there are 2000 records;)
Initial flow run screenshot
So why is this process only loading 256 records? Hmm, thanks to Sanjay Raut who was working with me on testing this process out last year for report bursting he found this Solved: 256 rows limit – Power Automate and it turns out there is a Pagination setting on the Excel List Rows step that you need to turn on and then set accordingly depending on how many records you might have. In this case I simply set this to 2100 to cover my test sample.
Excel file list rows pagination setting screenshot
Now when we reset the Excel file and re-run the process we see that it took a little longer to read all of the records in the Excel file and that the Apply to Each step is going to loop through 2000 records:)
Update flow run screenshot
Another setting that you will want to be aware of is on the Apply to Each step which controls the concurrency. This is important and you will want to adjust this accordingly depending on how long it takes to run a report and stay within the Power BI connector throttling limits (100 calls per 60 seconds). If you do not enable this then the flow will only process one record at a time, in this test I have it set to 15 (20 is the default when enabled and 50 is the max).
Apply to Each step concurrency setting screenshot
I figure if I can process 30 to 60 reports per minute that is really good and will stay within the throttling limits. I don’t believe that will actually happen, probably more like 20 per minute, but we will see;)
For the second Apply to Each step to reset the file I don’t have the concurrency set to avoid any type of blocking, simply loop through the 2000 records and reset them back to Processed value of ‘No’.
Now that the flow is running the PDF files are being generated in the OneDrive folder as expected –
PDF files being loaded into OneDrive folder screenshot
I took a look at the progress after an hour and based on the Excel file I could tell that it had generated 1,384 files which is around 23 files per minute. Based on this information the process will complete in another 30 minutes, so 1 hour and 30 minutes from start to finish.
I reviewed one of the PDF files out in the OneDrive folder just to make sure everything looked good –
PDF file generated from the flow in OneDrive screenshot
Once the process completed I verified the file count and then reviewed the metrics from the Capacity Metrics App and AAS QPU utilization is Azure portal.
Verified file count in OneDrive folder screenshotCapacity Metrics App screenshot during the flow process screenshot
With just this process running the capacity was not overloaded and used roughly 15% with the background process running which gets evaluated over a 24 hour period.
AAS QPU metrics from Azure portal screenshot
And AAS was barely being utilized maxed out at 5 QPU (the S1 has 100 QPU available).
Some things that I will need to compare this process against would be the following –
Moving the AAS database being referenced to a Power BI dataset hosted in the same capacity as the Paginated report
Just don’t forget when running this type of a load to test (and A-SKUs work great for this so you don’t impact production P-SKUs) and make sure to check out the additional settings pointed out earlier like the pagination and concurrency.


 Subscribe to Blog feed