Dan English's BI Blog

Welcome to my random thoughts in regards to Business Intelligence, databases, and other technologies

Archive for the ‘Reporting Services’ Category

Drillthrough support in Paginated Reports now available!

Posted by denglishbi on June 15, 2023

Last month there was a new update that has been made that provides support for drillthrough report actions in the Power BI service (Microsoft Fabric)! Those of you who are familiar with SQL Server Reporting Services (SSRS) know what a great feature this is to include in your reports to allow users to jump to another report for additional information such as detail level report and even allow the ability to pass the context (parameters) to the report.

Drillthrough was a big item that might have been a blocker for some companies preventing them from migrating from on-prem SSRS or Power BI Report Server (PBIRS) to the Power BI, well not anymore:)

So how does this work? Well very similar to how it does in SSRS/PBIRS with a slight modification that I will highlight. If you are familiar with Actions this works the same, but the “Specify a report:” and “Use these parameters to run the report:” sections have to be done manually, you are not able to use a dropdown to select the report and the parameters will not auto-populate for you.

Paginated report configuring text box action properties

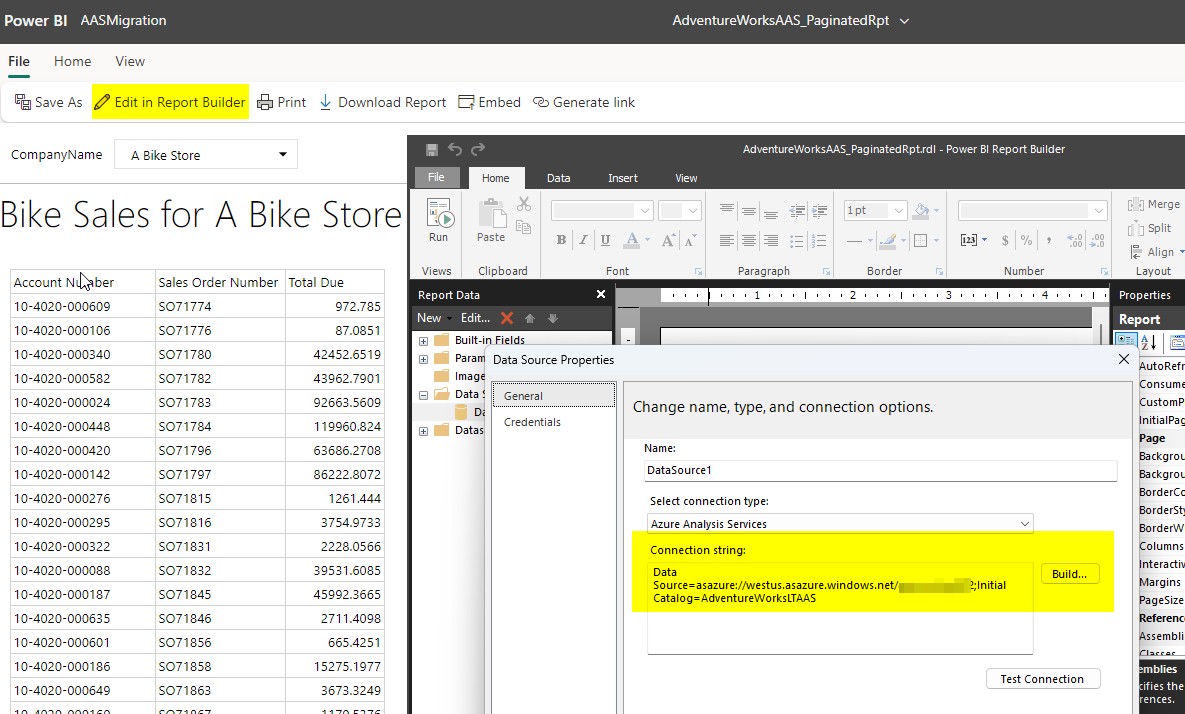
In the sample report above which I downloaded from our Paginated Report samples I updated the SalesTerritoryCountry text box on the CountrySalesPerformance report to “Go to report” (drillthough) RegionalSales. On the RegionalSales report I have two parameters, one for CalendarYear and the other for SalesTerritoryGroup.

Once this is configured you will need to publish both of the reports to the same workspace in the Power BI service and then when you hover over the text box configured with the drillthrough action you will see your icon switch over to the hand indicating that you can click on it like the following screenshot shows when I hover over “NORTH AMERICA” –

Drillthrough hand icon over North America sales territory group heading

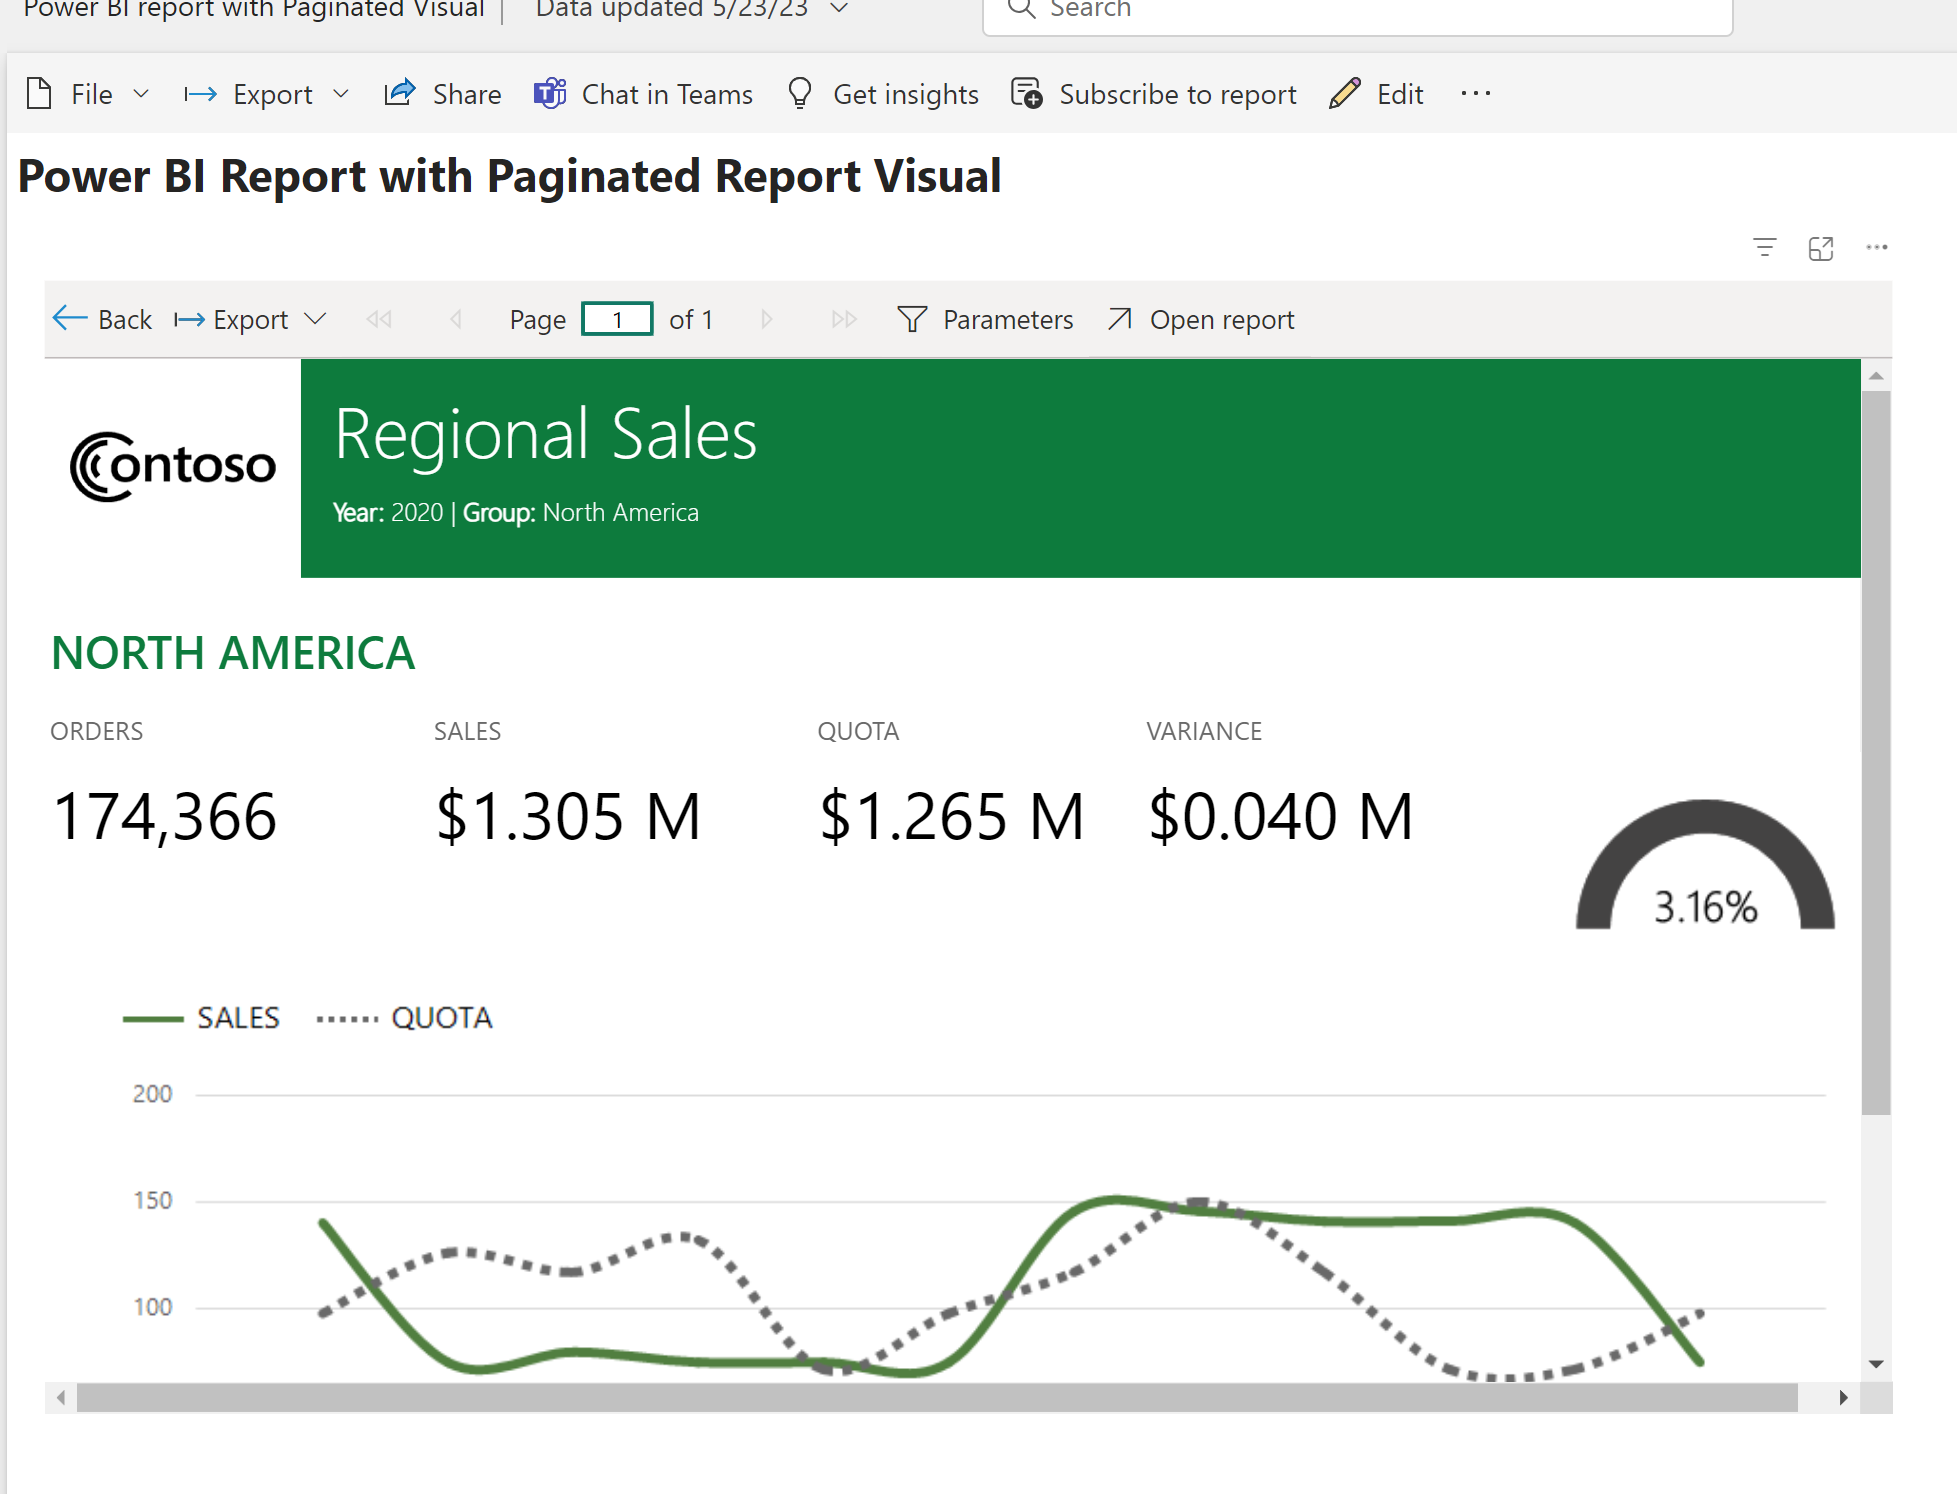
When I click on “NORTH AMERICA” then I will get sent to the report configured with the drillthrough RegionalSales and it will pass the corresponding configured parameters in the action and I get a nice little notification since this is the first time I am doing this and it has similar “<- Back” navigation like you are used to with on-prem reports as well as Power BI reports that use drillthrough.

Drillthrough report, RegionalSales

In the toolbar you can view the parameters and see that the values were passed from the parent report, CountrySalesPerformance, and set on the RegionalSales report.

Parameters on RegionalSales report

If by chance you click on an item in the parent report that passed parameter values that were not available in the child (drillthrough) report then you would see the following when I click on “PACIFIC” –>

RegionalSales after "Pacific" was clicked on in parent report

The entire report is blank because “PACIFIC” was not a valid value in the parameter options for Sales Territory Group. So to fix this I would need to review the RegionalSales report, include that value and maybe add some additional handling of no data by setting the “NoRowsMessage” on the tablix region on the report. So now if the user clicks on this option they would see the following –

RegionalSales report with no Pacific data rows message

And in case you were wondering, will this work in a Power BI report within the Paginated Report visual…well it does now and that is why I delayed posting this blog by 3 weeks and have been patiently waiting and testing for this last item to be made available (see below example).

Power BI report using a Paginated report visual with Drillthrough

And if you were wondering about how many levels you can go with drillthrough, the answer is 4 levels as documented here where it states the following “In paginated reports, you can drill through reports down to four (4) levels of child reports.”

Another thing to be aware of is if you are using the migration process built into on-prem SSRS or PBIRS that you will no longer get the unsupported feature message (thanks to Cookie McCray for confirming this for me) and this has been removed from the unsupported features section of the FAQ documentation here now.

What do you think about this new capability? Are you excited? Will this now allow you to migrate your reports if this was one of your blockers previously? Would love to know how you are using Paginated reports in the service today and if there is anything else that might be preventing you to migrate to Power BI (Microsoft Fabric) now.

Posted in Power BI, Reporting Services | Tagged: , , | Leave a Comment »

Power BI Report Source Redirection after AAS to PBI Migration

Posted by denglishbi on February 3, 2023

This is a follow up to the post Azure Analysis Services (AAS) Migration to Power BI Premium Experience that I did back in December. In that post I mentioned the following towards the end of the post –

If you have existing Power BI reports using the AAS live connection you are able to use the report rebind API to point the report to use the Power BI dataset. The one thing to note as pointed out in the documentation is that as of now if you need to modify the report layout you would need to do that directly in the service. That portion of the migration process is still being worked on and hopefully should be updated to resolve the issue so that you will be able to download the redirected report from the service, modify it, and then publish the report back to the Power BI service.

In this post I want to touch on this a bit more and provide some follow up based on work that has taken place since that post on the migration rebind (redirection) process.

In my Power BI workspace I have two reports that are connected to my original AAS database used in the migration process, one is a Power BI report and the other is a Paginated (Operational) report.

Screenshot showing two reports in workspace - Power BI and Paginated

If we look at the lineage view we can see that both reports are referencing Analysis Services –

Screenshot lineage view of reports showing connection to Analysis Services

I have already gone through the AAS to PBI Premium migration and moved the database from Azure Analysis Services to the Power BI Premium workspace shown above and it is named ‘AdventureWorksLTAAS’ as shown below in the screenshot.

Screenshot showing the migrated AAS database 'AdventureWorksLTAAS'

Now what we can do is use the APIs to redirect both reports from using AAS so that they use the new Power BI dataset. Since I have to different types of reports I will be using two different APIs and we will start with the Power BI Report. To do this I will open up Windows PowerShell ISE as Administrator, login to Power BI, and then call the Report Rebind in Group API. Below is the outline of the steps to use and I included the install of the Power BI modules as well. You would need to include the values of the new dataset, workspace, and report and remove the square brackets.

#STEP 1: run PowerShell as Administrator

#STEP 2: run script if you don't have this module installed, might get prompted to install library
If (!(Get-module MicrosoftPowerBIMgmt)) {
Install-Module -Name MicrosoftPowerBIMgmt
}

#STEP 3: login to service (you will get prompted)
Login-PowerBIServiceAccount

#STEP 4: rebind report to Power BI dataset (new model)
$body = @{ "datasetId" = "[new dataset id]" }
Invoke-PowerBIRestMethod -Method Post -Url "https://api.powerbi.com/v1.0/myorg/groups/[workspace id]/reports/[report id]/Rebind" -Body ($body|ConvertTo-Json)

Once this is completed you will see that the lineage view has changed for the Power BI report so it is now referencing the Power BI dataset that was created as a result of the AAS database migration.

Screenshot showing lineage view of the Power BI report referencing the dataset now instead of AAS database

Now we will do a similar process with the Paginated report, but for this you need to use the Update Datasources in Group API since this is an RDL report file. Below is the code used for this in PowerShell and you would need to provide the corresponding values for the datasource name, workspace XMLA endpoint, dataset name, workspace, and report and remove the square brackets.

#STEP 1: run PowerShell as Administrator

#STEP 2: run script if you don't have this module installed, might get prompted to install library
If (!(Get-module MicrosoftPowerBIMgmt)) {
Install-Module -Name MicrosoftPowerBIMgmt
}

#STEP 3: login to service (you will get prompted)
Login-PowerBIServiceAccount

#STEP 4: rebind report datasource to Power BI dataset (new model)
$body = '{
"updateDetails":[
{
"datasourceName": "[datasource name]",
"connectionDetails": {
"server": "[workspace xmla endpoint]",
"database": "[dataset name]"
}
}
]
}'

Invoke-PowerBIRestMethod -Method Post -Url "https://api.powerbi.com/v1.0/myorg/groups/[workspace id]/reports/[report id]/Default.UpdateDatasources" -Body $body

The one thing to note about this process for the Paginated report is that the actual RDL file doesn’t get modified. So if you were to download the file or use the option in the service to “Edit in Report Builder” you would still see the AAS information. If you view the lineage though you will see that it is referencing the Power BI workspace now via the XMLA endpoint as shown below.

So an alternate option if you actually want the Paginated report file definition updated would be to use the “Edit in Report Builder” option and change the actual information or update the file that you might have in source control and simply republish.

Screenshot showing the Edit in Report Builder and viewing the data source information for the Paginated Report.

Now the final thing I want to wrap this post up with is the issue regarding modifying the Power BI report files as I mentioned in my previous post as well as which is highlighted in the “Import Considerations” section of the AAS migration documentation.

During preview, if you use the Reports – Rebind Report Power BI REST API to create a new binding to the migrated dataset, you can’t make changes to reports in a Power BI Desktop .pbix that were previously bound to the model in Azure Analysis Services and then republish to Power BI. Report changes for a migrated dataset can be made in the Power BI service.

What you will see if you download the Power BI report file from the service, modify it, and then try to publish it back to the workspace is the following message.

Screenshot of the dialog stating that report with that name already exists and rename the file and publish again.

This is the item that was being worked on and I am happy to announce an update is currently being deployed to resolve this. This update is in the process of being deployed to the service so it will take some time to make it available in all regions, but once it is what you will be able to do is use the “Upload” option in the workspace to get your updated file available.

Screenshot upload file option in workspace

There is of course still the option to simply update the files directly in the service as mentioned. The other fix that is coming and will be available in the March Power BI Desktop release is to resolve the dialog message above “Couldn’t publish to Power BI” when you publish.

With the March release you will see the following message when you publish your report that you downloaded after the report rebind and want to publish changes back to the service.

Screenshot showing successful Power BI report publish to service.

That is what we like to see:)

So I would be curious, has anyone been using the AAS to Power BI Premium migration process? If so, what has your experience been and what kind of feedback do you have? Feel free to leave a comment, I would be very curious to know more about your journey!

Posted in Analysis Services, Power BI, Reporting Services | Tagged: , , , | 5 Comments »

SQL Server 2017 CTP2.1 Install Experience

Posted by denglishbi on May 18, 2017

In this post I will walk through the install process highlighting the changes of the SQL Server 2017 install. This will be using the CTP2.1 release (May 2017) of the installer and I will also be using the new Power BI Report Server install which is a new light weight installer that is not part of the core server product installation.

I will just include some of the key screenshots from the installation and highlight some of the differences.

Install SQL Server 2017 CTP2.1

image

image

image

We can see here that Reporting Services has now been removed from the core installation similar to SQL Server Management Studio and SQL Server Data Tools. This is now a more light weight installation and it needs to be downloaded separately, just like Power BI Report Server.

image

So we see that now for Machine Learning there is also Python support and that SSIS has new scale out capabilities. In addition to this Reporting Services – Native installation has been removed (and no more SharePoint integration!).

image

New Consent to Install Python, similar to the experience we have seen with Microsoft R Open.

image

image

Everything successfully installed that we selected!

Install SQL Server Management Studio 17.0

image

image

image

The new SSMS 17.0 splash screen.

image

Build Version for SQL 2017 CTP2.1 – 14.0.600.250

Installing Power BI Report Server

This is available for customers that purchase Power BI Premium or have SQL Server Enterprise Edition with Software Assurance.

image

image

image

image

image

image

Once you have completed the install then you will need to use the Report Service Configuration Manager to connect and complete the setup tasks – creating database, establishing the web service and web portal URL, etc.

image

What we see here is that it has created a named instance for the Power BI Report Server called ‘PBIRS’.

In reviewing the new tables that are part of this installation I noticed three new tables: CleanupLock, Comments, and ProductInfoHistory. The first two tables are blank for now, but the ProductInfoHistory did have one record in it stating the build number for the current SKU installed.

image

I just noticed one other item, it appears in the configuration table you can control if users have the ability to export Power BI report data and this can also be accessed if you connect with SQL Server Management Studio and review the Advanced settings. The ability to control the Custom Visuals is also an option.

image

image

image

Successful configuration and you can see we have a similar color scheme like the Power BI Service for the default and using the new Power BI logo, very nice.

So the new Power BI Report Server is a superset of Report Server where it contain mobile reports, KPIs, paginated reports, and now Power BI reports. Plus you can upload Excel workbooks and we expect them to be viewable in the browser in the near future like Power BI reports.

Now to make Power BI reports that are supported in Power BI Report Server you need to use the Power BI Desktop (Report Server) version of the application, which is a separate install as well and can be installed side-by-side with an existing version of the Power BI Desktop applications.

The May 2017 release of Power BI Report Server will now support Power BI Custom Visuals, so that is really cool!

Install Power BI Desktop (Report Server)

image

image

image

image

image

image

image

From the start screen here you will see a new option to ‘Open from report server’ and some Reporting Services links to the forums, blog, and tutorials.

image

image

I can open up an existing report and then deploy this to the Power BI Report Server. Just remember that currently only Live SSAS connections are supported as a data source, no other data sources are supported for the time being, hopefully later this year we will see additional support so that we can use embedded models.

image

To publish to the Power BI Report Server simply select File—>Save as—>Power BI Report Server

image

Enter the Web Portal URL

image

Pick the location if you want to place it in an existing folder possibly and then click OK.

image

Then you can click on the ‘Take me there’ link and you will be able to view your report.

image

From here you can interact with the report, print it, different options for viewing the report (fit to width, fit to page, and actual size), open it back up in Power BI Desktop, explore the data, refresh the report, filter the data, add comments to the report (comments also support ability to add attachments as well).

Now if you are not able to install Power BI Report Server (and remember, if you can use this, you will still need additional Power BI Pro licenses for the report authors and users that want to export the reports to say PowerPoint or CSV, sorry no Excel option yet…) you can install the regular Reporting Services.

Install Reporting Services

Nothing too different from the Power BI Report Server installation.

image

image

image

image

image

image

image

This time the named instance that tool creates is called ‘SSRS’.

After the install you can go into the Reporting Services Configuration Manager and complete the configuration, just like in versions past.

So that is it for now, hope you enjoyed the quick walkthrough experience of the new SQL Server 2017 installation!

Posted in Power BI, Reporting Services, SQL Server | Tagged: , , | 1 Comment »

On-Premises Power BI VOL. 2

Posted by denglishbi on May 5, 2017

Here we go again, round 2 (or should I say Vol. 2). I am back to discuss how I feel (and I am sure quite a few others do as well) about the new information we received this week on Microsoft Power BI on-premises. You can check out my first blog post regarding this here – On-Premises Power BI–A Microsoft Story.

All of the opinions and information that I state in this post here is simply my personal experiences as well as a few thoughts that I just wanted to post. Oh and by the way, I am not a graphic artist by any means, so please don’t slam me for my mocked up image below. I love movies, so just wanted to put this quick little graphic together, I hope you like it.

image

What we have learned this week is that Microsoft will provide customers two options to get the on-premises Power BI functionality that will be part of what has now been called Power BI Report Server (this is actually a superset of Report Server – so includes all Report Server functionality plus Power BI). Option 1 is for organizations to go with the new Power BI Premium option. So basically along with the Power BI Service cloud functionality, Microsoft is providing customers the on-premises Power BI Report Server which will include a SQL Server Technology License that you can use to install Power BI Report Server, database engine, and Analysis Services (SSAS) on a single server. The SSAS will provide users the ability to create the data models for the live SSAS connections that Power BI on-premises will initially support. Basically this option will cost an organization roughly $5k/month at minimum based on the calculator (so we are talking at least $60k/year).

Option 2 then is for customers that purchase SQL Server Enterprise Edition (EE) along with Software Assurance (SA). If you have this then you will be entitled to Power BI Report Server, but there is a catch, read all of the fine print in the post (particularly the bold text).

Power BI Report Server is an on-premises server that enables Power BI Pro users to publish Power BI reports and distribute them broadly across the enterprise, without requiring report consumers to be licensed individually per user.

So what this means is that even though you just invested $XXX,XXX six figures or possibly more for your SQL Server EE + SA you will also need to pay a $10/month subscription fee for each Power BI Desktop report author that wants to publish reports to the Power BI Report Server. But wait, there is more! If consumers of the report want to export reports to say PowerPoint or Excel (and come on, how many users don’t want to export reports…), they will also need Power BI Pro licenses.  Granted the text might not call that out specifically, but that is what is also meant by “distribute”.  What most users will see is just the following in the post:

without requiring report consumers to be licensed individually per user

So that statement is not necessarily true from what I have been told, if a user wants to export a report, that will cost each user $10/month subscription because they will require a Power BI Pro license.

Now I don’t believe technically Microsoft will be able to enforce and track the Power BI Pro license for on-premises to enable / disable features such as publishing and export, but if you were ever audited then that could come back to bite you if you didn’t purchase them and are using this functionality.

How do I feel about this…. I am not happy by any means. I don’t understand this at all to try and nickel and dime customers of SQL EE + SA that want to leverage the Power BI on-premises. First Power BI wasn’t made available to SQL 2016 customers and has been pushed (or at least we thought) into SQL 2017 (formerly known as vNext). Now we are finding out that the Technical Previews of Reporting Services we have been using with Power BI functionality is not going to be made available to SQL 2017 customers unless you purchase EE + SA. But even if you do purchase that you also have to buy Power BI Pro subscriptions!!!

Hmmm…. I am trying to draw a comparison here of how I see this being played out.

image

Do you see where I am going with this? Can you draw any similarities here? T-Mobile vs Sprint?

So for my company we already have on-premises Power BI and we have been using this now for almost a year. This is because we own BI Office (Pyramid Analytics). For BI Office on-premises Power BI is provided and supported and there are no hidden fees, taxes, charges, costs, etc. associated with the product to get this functionality. All we need to do is pay our yearly maintenance agreement (and that is like 60% less than what we would need to pay for Power BI Premium). And in addition to Power BI on-premises we also get all of the BI Office features like dashboards, R integration, and much more! I can actually incorporate BI Office reports, SSRS reports, Power BI reports, and more all on a single dashboard page and they can all interact with each other!!! How cool is that? Kind of reminds me of PerformancePoint, but this actually works and is much easier to configure!

I am truly disappointed in the decision that has been made here for Microsoft customers. We have been working on our new BI roadmap for the Power BI the past two years, had a delay in the Power BI on-premises release, and now we need to possibly payout even more money. That is confusing and frustrating for customers (and champions / advocates of Microsoft BI like myself) and is definitely going to bite Microsoft. Enough with the games Microsoft, have we not been patient enough? I am sorry to say that now we are most likely not going down this path and I am extremely upset about this because I have been wanting and pushing for this capability. So for us we are going back to the BI roadmap and looking at Plan B and focusing our attention on the un-carrier.

Posted in Power BI, Reporting Services | Tagged: , , | 21 Comments »

Reporting Services SharePoint Large Parameter List Issue & Fix

Posted by denglishbi on November 8, 2012

UPDATE (11/13/2012): Additional modification needed to provide ability to manage the parameters in SharePoint (see the bottom of the post for the updates)

If you are using Reporting Services (SSRS) in SharePoint Integrated Mode (I saw this issue with SSRS 2008 R2 SP2 & SSRS 2012 with SharePoint 2010 running with SP1 CU Aug 2012), then something you might want to be aware of.  If you ever have to load a parameter list with lots of records (say 35K+) then you might end up receiving a message like this:image

An error (Unable to read data from the transport connection: The connection was closed.) occurred while transmitting data over the HTTP channel.
Unable to read data from the transport connection: The connection was closed.


If you are running the report in BIDS or SSDT or Reporting Services Native Mode you will be fine, just an issue with SharePoint Integrated Mode.  I also noticed this with a report that had approximately nine parameters (four were hidden) and two of them had approximately 10K records.  So I think it was the combination of the parameters along with some default values getting set that caused the issue.

REPRO: For a quick example of this issue you can easily replicate this with populating a parameter with the FactFinanceKey from the AdventureWorksDW2012 database.   Deploy the report to SharePoint and try and run it:)

I have filed a Microsoft Connect Bug for this here – Reporting Services (SSRS) SharePoint Large Parameter Issue

Well after a bunch of searching and digging through the forums, blogs, BOL, and additional documentation (and even tried an old ProClarity fix) I found the fix for the issue – MaxItemsInObjectGraph….yes, that was a setting that I had to incorporate into a couple of the configuration files for Reporting in SharePoint:S

The first forum posting that pointed me to the web.config and client.config files was Issue Exporting SSRS 2012 Report to CSV file in SharePoint 2010 (MaxReceivedMessageSize property exceeded) and then after doing some additional research running live log tracing on SharePoint I tracked down that it was really related to the WCF and I came across this additional MaxItemsInObjectGraph setting in quit a few posts such as this one MaxItemsInObjectGraph and keeping references when serializing in WCF.

Now I didn’t find the magic post that just told me what to do, but with some trial-and-error I came up with the following steps to fix this:

1. Edit the web.config file in the following location C:\Program Files\Common Files\Microsoft Shared\Web Server Extensions\14\WebServices\Reporting

NOTE: prior to modifying a config file, always make a backup of the file first and use a text editor like notepad, notepad++ to modify the file, do not use a rich text editor.

2. In the web.config file find the <behaviors> section and make the following addition:

    <behaviors>
      <serviceBehaviors>
        <!–
            Notes:
             1) maxConcurrentCalls is set to 16(default value in .Net3.5)*Processor Count(assuming 32)
             2) maxConcurrentInstances is set to 512 since InstanceContextMode is PerCall
             3) These settings can be removed after upgrading to .Net 4.0
         –>
        <behavior name=”RSExecutionBehavior”>
        <serviceThrottling maxConcurrentCalls=”512″ maxConcurrentInstances=”512″ />
        <serviceMetadata httpGetEnabled=”true” />
        <serviceDebug includeExceptionDetailInFaults=”true” />
        <dataContractSerializer maxItemsInObjectGraph=”2147483647″ />

        </behavior>
      </serviceBehaviors>
    </behaviors>

3. Save the file and then go and edit the client.config file, remember to make a backup copy prior to modifying it.  This file is located in the following location C:\Program Files\Common Files\Microsoft Shared\Web Server Extensions\14\WebClients\Reporting\

4. In the client.config file add the following section below the <System.ServiceModel> tag and before the <client> tag

  <system.serviceModel>
    <behaviors>
      <endpointBehaviors>
        <behavior name=”RSExecutionBehavior”>
      <dataContractSerializer maxItemsInObjectGraph=”2147483647″ />
        </behavior>
      </endpointBehaviors>
    </behaviors>

    <client>

5. Now I also modified four of the endpoint settings in the <client> section to reference the new behavior that I added (IReportExecution and IReportStreamingAsyncClient):

<endpoint name=”https” contract=”Microsoft.ReportingServices.ServiceContract.IReportExecution” binding=”customBinding” bindingConfiguration=”https” behaviorConfiguration=”RSExecutionBehavior”/>
<endpoint name=”http” contract=”Microsoft.ReportingServices.ServiceContract.IReportExecution” binding=”customBinding” bindingConfiguration=”http”  behaviorConfiguration=”RSExecutionBehavior”/>

<endpoint name=”https” contract=”Microsoft.ReportingServices.ServiceContract.IReportStreamingAsyncClient” binding=”customBinding” bindingConfiguration=”httpsStreaming”  behaviorConfiguration=”RSExecutionBehavior”/>
<endpoint name=”http” contract=”Microsoft.ReportingServices.ServiceContract.IReportStreamingAsyncClient” binding=”customBinding” bindingConfiguration=”httpStreaming”  behaviorConfiguration=”RSExecutionBehavior”/>

6. Once that was done I had to restart the server where the Reporting Services application was running.  The web.config settings seemed to work right away, but not the client.config settings.  Once it restarted I warmed up SharePoint and got SSRS running again.  I tested out my report and it started up just fine, no error message:)

image

And that is the fix, can’t believe this is the first time I have come across this issue, but now there is a fix and it is documented:D  Just a word of caution, this still does not perform as well as it does in SSRS Native Mode, but at least it does work now.  It appears that it takes maybe twice as long to load in SharePoint as it does through the Report Manger (your mileage may vary though).

I have filed a Microsoft Connect Bug for this here – Reporting Services (SSRS) SharePoint Large Parameter Issue

UPDATE (11/13/2012): Additional modification needed to provide ability to manage the parameters in SharePoint –

One quick update on this – there is one more additional service & endpoint that needs to be updated in the config files as well. The reason is so that you can manage the parameters in SharePoint if needed.

Web: <service name=”Microsoft.ReportingServices.ServiceRuntime.ReportServiceManagement” behaviorConfiguration=”RSExecutionBehavior”>

Client: <endpoint name=”https” contract=”Microsoft.ReportingServices.ServiceContract.IReportServiceManagement” binding=”customBinding” bindingConfiguration=”https” behaviorConfiguration=”RSExecutionBehavior”/>

I added the behaviorConfiguration reference. Not only did I update this in the web.config file, I also updated the endpoints in the client.config file as well. It seems like it picked up on the change without a reboot this time as well, so the web.config setting seemed to work, but wanted to keep things in synch so I updated the client.config as well. This time though I did receive a valid SharePoint error message and was able to look it up in the logs to pinpoint the additional service being referenced for this operation. There are two other items in the config file – ReportServiceBackgroundProcessing and AlertManagement – and I have not had to alter these ones yet.

NOTE: Also, in a multi-server environment I had to update the client.config file on the WFE server (web.config did not exist since it wasn’t the application server) and restart that one to get the reports to behave consistently.

Posted in Reporting Services, SharePoint | Tagged: , | 5 Comments »

Presenting Power View Reports to Users

Posted by denglishbi on October 17, 2012

As you begin to use the new Power View reporting feature that is available with the Reporting Services 2012 integration in SharePoint 2010 one of the things that you will need to assess is how you are going to allow the users to access the reports.  What are the different options that you have when providing access to the Power View report files (rdlx) in SharePoint?

Here is a list of options that you could use:

  • store the Power View reports in a Document Library
  • display the Power View reports in a PowerPivot Gallery
  • use a Page Viewer Web Part to display the Power View report
  • use a Silverlight Web Part to display the Power View report

Here is how each of these will look to the end-user that will be access the reports:

Document Library

image

Above we can see that the Power View report files are available and stored in a document library, nothing really fancy, just storing the rdlx files.

PowerPivot Gallery

image

The PowerPivot Gallery is a very nice option to display the Power View reports. Provides a nice visual display of the reports and users are able to see if additional views are included in the files as well.  The view I have displayed above is the default Gallery setup, but additional options are available such as just displaying the files in the document layout like the Document Library display in the first example, Theater, and Carousel.

Page Viewer Web Part

image

The Pager Viewer web part is a nice option to include a Power View report (or a particular view) on a page.  This is a nice option to include a Power View report into any existing page and to provide a nice controlled output of the report.  You can see that the ‘Preview Bar’ has been removed from the top of the report so a user is not able to access the ‘Edit Report’ option.  The users are still able to interact with the report and access the different views in the report as well.

image

How do you configure the Page Viewer web part?  Pretty basic and a bit easier than the next option that will be looked at.

  1. Create a web part page
  2. Add a Page Viewer web part to the page
  3. Specify the URL path along with additional parameters for the report
  4. Specify the height and width for the web part for the appearance

Here is what the Page Viewer web part settings look like for the example displayed above:

image

Here is the URL path that I have specified along with some additional parameters that I am setting to provide the desired output:

/_layouts/ReportServer/AdHocReportDesigner.aspx?RelativeReportUrl=/Shared%20Documents/Hotel%20Performance%20Dashboard.rdlx&ViewMode=Presentation&ReportSection=ReportSection2&True&Fit=True&PreviewBar=False

In this example I am setting the View Mode, the Report Section I want to display, and hiding the Preview Bar.  These are the core settings that need to be set to get this output.  There are additional settings that you can explore and a few of these I discuss here in the following post URL Actions with Reporting Services Power View (RTM) and as one person commented there are additional parameters available and you can see these by accessing the properties of the output in PowerPoint as discussed here Can i edit my PowerView Report exported to PowerPoint in Presentation Mode? YES YOU CAN.

If we dig into the above output for the Pager View web part we can see that the output is displayed in an iframe and granted just by removing the Preview Bar doesn’t mean that the user couldn’t track down the actual location of the report and launch it from there, so this by no means is a security option.  The user still needs the proper permissions to the Power View report file (Restricted Readers – requires the ability to Open Items and this is different compared to regular Reporting Services reports because of the Silverlight application).

image

Silverlight Web Part

image

The Silverlight web part display looks identical to the Page Viewer.  This option requires a bit more of setup and I have to thank Robert Bruckner for the details on configuring this option.

    1. Create a web part page
    2. Add a Silverlight web part to the page
    3. Specify the URL path to the Silverlight application
    4. Specify the custom initialization parameters (Other Settings)
    5. Specify the height and width for the web part for the appearance

The path to the Silverlight application is the following:

/_layouts/ReportServer/ClientBin/Microsoft.Reporting.AdHoc.Shell.Bootstrapper.xap

The custom initialization parameters that I used in the example above are the following:

ItemPath=http://win-doqtev64aj4/Shared%20Documents/Hotel%20Performance%20Dashboard.rdlx,ReportServerUri=http://win-doqtev64aj4/_vti_bin/reportserver/,ViewMode=Presentation,PreviewBar=False,Fit=True,ReportSection=ReportSection2

The template Robert provided for this setup is the following for the parameters:

ItemPath=http://<YourServername>/<YourSite>/YourReport.rdlx,ReportServerUri=http://<YourServername>/_vti_bin/reportserver/,ViewMode=Presentation,PreviewBar=False,Fit=True

Here is what the Silverlight web part settings look like for my example above:

image

When you add the Silverlight web part to the page you will be prompted for the URL path for the Silverlight application. That setting and address is also available in the above screenshot in the Application settings when you click on the ‘Configure…’ button.

You can once again dig into the output like we did above with the IE Developer Tools (F12) and you will see the following:

image

A little different output here and if you dig around enough you will eventually track down the initialization parameters, so once again not an option to prevent the users from finding out the original source of the file, but it is still an option that you can use to display Power View reports in a web page.

Summary

So to wrap up this post, I just wanted to show the different options you have available in SharePoint to display and provide access to Power View reports to end-users.  The first two options allow the users to launch the reports in the web browser and access the Edit Report or go into Full Screen modes.  I would use the PowerPivot Gallery option because of the nice output and provides the users quick insight as to what is included in the report and an overview of the different views (if more than one exists).  The last two options would be something to explore if you want to include a Power View report on a web page.  This is a nice clean option where we have removed the Preview Bar, but have still allowed the user access to the report to interact and browse the different views.  This could be a nice option if say you want to include a Power View report in a PerformancePoint dashboard.

I hope you have enjoyed this quick overview and for more information on how to use Power View and creating tabular models, don’t forget to check out our book here – Visualizing Data with Microsoft Power View.

Posted in Reporting Services, SharePoint | Tagged: , , | 4 Comments »

Using PowerPivot Model Images with Excel 2013 Power View

Posted by denglishbi on September 13, 2012

[tweetmeme source=”denglishbi” only_single=”false”]

As you have heard and possibly seen in my other Excel 2013 posts, Power View is coming to the Office suite.  This is great news to everyone that uses Excel.  The one thing you might be curious about is how to include and reference images within your data model.  This post will cover the options that you have and provide a few screenshots of the process.

Database Images

If you are working with data that resides in a database and the images are stored in the database table you will be able to work with them once you load the data into your data model within PowerPivot.  This hasn’t changed at all, the only thing that has changed is that now you don’t have to upload your PowerPivot file into SharePoint to create the Power View report.  Instead you can simply insert a new Power View report and create your reports.

Here is a quick look at this type of a setup.

First the database tables have to be in place.  In this example I am going to reference two different tables that will have images in them, one for authors and the other for books.

image

Once the records have been added to the tables we just need to add the images and one way to do this is with some T-SQL and OPENROWSET command as displayed in this blog post here – Insert binary data like images into SQL Server without front-end application.

image

Once the data is in place we need to create our model, so we will open up Excel 2013, go into the PowerPivot window, load the data into our model, define relationships, and do some advanced setup on our tables.

Let’s take a quick walkthrough of this process if you are not familiar with this yet.

image

Once you have activated the PowerPivot add-in in Excel 2013 you will be able to select that tab in the ribbon and manage your data model.

image

Once you are in the PowerPivot window you will be able to get external data and import data into your model.

image

Select the tables you want to work with in your model.

image

Import the data.

image

Switch over to Diagram View and drag-and-drop the fields to establish relationships between the tables.

image

Select the Author table and define the Table Behavior so you can define the default label and image for each record.  Do the same for the Book table.  Now that you have that setup one last step you can do before you start to use the model is to perform some cleanup.

image

Here we have hidden the two row identifier columns in each of the two main table and also hid the reference table that relates the two tables.  You can do this by simply right-clicking on the items and selecting ‘Hide from Client Tools’ from the context menu.

Now you can switch back to Excel and from the Insert tab in the ribbon select Power View.

image

Now we will see the two tables in our model and the item that we are particularly interested with is that the Photo column is available and the key step was the configuration step in the Table Behavior.

image

Now we can select the items in the field list and start to put together a report such as this –

image

Web Server Images

Another option you have for referencing images in your Excel PowerPivot model is to store the image files on a web server.  The one thing that you need to make sure is that the web site is setup with Anonymous authentication and users have permissions to the file location.  Once that is setup you can establish a URL reference to these images files in your table within your model.  After the URL is configured you will need to review the advanced settings just like the database image setup so that you can reference the images in your Power View report.

Let’s take a quick look at the difference here.  First we have the anonymous web site.

image

Then we place the files on the web server to reference in the location we defined for the web site.

image

Make sure that users have access to the location.

image

Now we go through the similar steps as we did in our first example, but after we define our relationships we need to go back into our tables and define the URL paths for our images.

In both tables we will create a calculated column called PhotoURL and with some DAX setup the paths to the images.

image

image

The secret here is to make it data driven, if you are not able to do this then you would need to store the URL values in the source table and import them.  Luckily with a little DAX we could setup a formula that will work for each record.  Now if someone wants to replace one of the images on the web server they can do so and it would be reflected in the report with a refresh.

The next step is to go into the Table Behavior like we did in the previous walkthrough and make reference to this new column for our default image.

image

Once this is done we can go ahead and switch back to Excel and create a Power View report, just like we did previously.

The one thing to note here is that when you switch over to the PhotoURL reference you will be prompted with a security warning about accessing external pictures.  Go ahead and click ‘Enable Content’.

image

Now we can look at our same report –

image

Only this time we are using the PhotoURL versus the Photo field.

image

Conclusion

And there you go, two different options for referencing and using images within your Excel 2013 Power View reports.  Using the web server setup is nice because then you can swap out the images a bit more easily, but you still have the option to store the images in the database if that is how you where you want to keep them. 

Now go ahead and try this on your own and really spice up your reports with some nice images:)

Posted in PowerPivot, Reporting Services | Tagged: , , | Leave a Comment »

Visualizing Data with Power View: Pan-Geo goes PowerPivot

Posted by denglishbi on August 9, 2012

[tweetmeme source=”denglishbi” only_single=”false”]

Back in June we released our book on Power View, Visualizing Data with Microsoft Power View.  Not only does the book contain great information about creating reports with Power View, but it also contains content on building tabular models that can be utilized with Power View.  The current release only works with tabular models, so either PowerPivot or Tabular Analysis Services (SSAS).  With our book we primarily focused on building out a Tabular SSAS solution that gets used for the majority of the Learn By Doing exercises.  Sure there are a few times where a PowerPivot file is referenced or we do some initial modeling in PowerPivot, but most of the work gets done with the tabular solution that gets deployed to Analysis Services.image

Well just a few weeks ago when Office 2013 Preview was released I decided to build out the entire Pan-Geo Hospitality & Travel model in PowerPivot.  I went ahead and replicated all of the exercises that we did in the tabular project into PowerPivot (using Excel 2010 and the SQL 2012 PowerPivot add-in).  I then took that same file and upgraded it up to Excel 2013 as well – Power View Meet Excel 2013.

image

So since I took the time to build this out I decided why not go ahead and share:)

If you are interested in Power View and especially if you have already purchased the book (hint, hint) I have gone ahead and uploaded the two Excel files to my SkyDrive here – Power View Book.

  • PGHT Tourism PowerPivot Model 2010.xlsx (Excel 2010 uses the SQL 2012 PowerPivot add-in)
  • PGHT Tourism PowerPivot Model 2013.xlsx (Excel 2013 uses the PowerPivot for Excel 2013 add-in)

Now in order to get a good download of these don’t open the Excel files up in the browser in SkyDrive, simply check the box next to the file and chose the download option on the right-hand side of the screen.  I would do them separately.  Then simply open them up and have at it.  Now if you want to use Power View in Excel you will need to download and install the Office 2013 Preview.  If you want to build out map reports with that you will need to make sure you have an Internet connection so that it can connect to the Bing Map service.

I would be very interested in some feedback and seeing what people build out with the PGHT dataset.  So feel free to leave a comment here or send me a tweet (@denglishbi).

Just an FYI, the Power View book is available on McGraw-Hill Professional, Amazon, Barnes & Noble, Google Books, as well as Kindle, Nook, and other eBook formats and sites.  Please check it out and leave us your feedback and comments:)

Enjoy!

Posted in PowerPivot, Reporting Services | Tagged: , , , | 2 Comments »

SQL Saturday Event Analysis using Power View and Office 2013

Posted by denglishbi on August 6, 2012

[tweetmeme source=”denglishbi” only_single=”false”]

Updated (8/7/2012): Added screenshot at end of post of which includes data broken out by fiscal calendar (starts in July) and link to that file as well.

Updated (8/9/2012): Added some information at the bottom of the post in regards to downloading issues and more information available in the comments section.

Last week I saw a post by Sam Vanga called SQL Saturday US Map.  Needless to say I found it interesting and a great idea.  That made me think a bit and I was like hmm… why not take that same data and use it with the new Excel 2013 with PowerPivot, Power View, and maybe even a little Office 365!  I had to leverage the Microsoft stack of course:)

So I went out to the SQL Saturday site and copied down all of the event details. Needless to say a little scrubbing was required because the data was a bit incomplete to get at some of the location information.  After a little while I felt fairly good with the data and loaded the information into PowerPivot for Excel 2013.  I added a few more columns around the date information to generate a calendar and to do some sorting.  Once that was done I went ahead and started to put together a little dashboard page.  I ended up with the following:

image

We can see that the SQL Saturday events over the past couple of years have really grown in popularity and after 2010 they went global as well.

image

We can zoom in on the map and get a close up as well.  Last year we had the SQL Saturday #99 in Eden Prairie, MN.

image

I even added the ability to drill down from the cities to the zip code level and also some drill down on the column chart for the counts as well.

image

image

Some pretty cool stuff.

We can even upload this into the Office 365 preview and share this information as well which support PowerPivot and Power View.

image

You might notice that the colors for the themes don’t match up quite yet, but other than that it works out well and you can interact with the Power View visualizations and reports!  In the above screenshot in Office 365 I have the tile where the map resides filtered to 2012.  You can see that the map really opens up now for the entire globe compared to the 2010 and 2011 views.  I can only assume that next year it will grow even more:)

The data that I grabbed for this was from the SQL Saturday events page here (just copy paste and a bit of cleanup).

If you would like to download the Excel 2013 file I created you can grab it from here – SQLData.xlsx

Fiscal Year Layout

I received a request from Karla Landrum the PASS Community Evangelist to see the data setup using the PASS fiscal calendar which starts in July versus the regular calendar.  Well I decided to add in a full date table and refresh the output.  Here is the result and the new file can be downloaded here – SQLDataFiscal.xlsx

image

If you are experiencing any issues with the downloads take a look at the comments section of this post.  I did some testing and found some issues if you try to directly download the file from the browser and a workaround if the SQLSat Dash does not load for you.  You can download the file(s) from my Public|Blog SkyDrive folder.

Enjoy!

Posted in PowerPivot, Reporting Services | Tagged: , , , | 15 Comments »

Power View meet Microsoft Excel 2013 Part 2

Posted by denglishbi on July 25, 2012

[tweetmeme source=”denglishbi” only_single=”false”]

Last week I did my initial post of going over using Power View inside of Excel 2013 – Power View meet Microsoft Excel 2013.  In that post I went over how I converted the PowerPivot model of the Pan-Geo Hospitality & Travel that was used in our Visualizing Data with Microsoft Power View book (well at least a Tabular SSAS version was used, I recreated the entire model in PowerPivot).  I upgraded that model to use the Excel 2013 version of PowerPivot and then showcased some of the new features such as:

  • Background Images
  • Pictures
  • Themes
  • Relationships
  • Pie Charts
  • Map Visualizations (Bing Maps)
  • Key Performance Indicators

So what other key features are that that might be of interest?  Hmmm, good question.  And yes, there are more features.  Have you been wanting support for hierarchies?  What about drill up and down capabilities?  Well guess what, you get them both:)

You might have noticed in the previous post that you saw some hierarchies listed in the field list:

image

Let’s take a quick look at using the Country Hierarchy and see how this looks in a table, matrix, and a chart.

Table

image

Matrix

image

Chart

image

So in the table and matrix no change other than the fact that we can see our hierarchies in the field list and select them.  This allows us to quickly add multiple fields to the canvas.  What about the chart though?  I picked the country hierarchy, but I am only seeing the first level of the hierarchy which are the continents.  Where are the countries?

Well if you double click on the columns in the chart it will actually drill down into that continent and display the data for the countries!

image

You will also see that the sort by and title text changed to display country and there is a new icon available when you hover over the chart, an arrow that provides drill up functionality.  So the drill up will bring you back up to continent. 

Now the neat thing about the drill up and down functionality is that you can expand on this.  The fields do not necessarily need to be part of a hierarchy, you can actually build out the drill up and down capabilities by adding fields into the field well.  So in this example I will add more fields into the chart below the country:

image

So let’s double click a few times to see what we get:

image

image

Now the one thing is that we really are not sure what we are looking at, meaning that what continent, country, and chain type did we select previously?  I can see based on the sort the trail that I have navigated, but what were the values associated with them.  That would be a nice feature.

The drill down also works for the map reports as well.

image

So if we double click on the China pie chart we will go down to the city level based on the navigation defined in the field well:

image

And you can use the zooming capabilities of the map as well.

image

Pretty cool and you can do more with the map with the layout settings in the Ribbon:

image

In addition to hierarchy, drill up & down, and cool map capabilities there is another minor addition that was added and that was support for hyperlinks in a text box.

image

In this example I have a text box that includes the words ‘Microsoft BI’ and below that a hyperlink to the web site.  If I hold the CTRL key and click on the hyperlink it goes to the web site:

image

They hyperlink simply gets added after you type in the URL and press a space, hit enter, or click out of the text box.

Well that covers the majority of the new enhancements to Power View, for the complete list checkout the links at the bottom of my previous posting – Power View meet Microsoft Excel 2013.

I will continue to work with the new features and post any additional findings I might come across like using images from the data models and the issues you might encounter along with using these files in SharePoint.

Posted in Business Intelligence, Reporting Services | Tagged: , , , | 13 Comments »