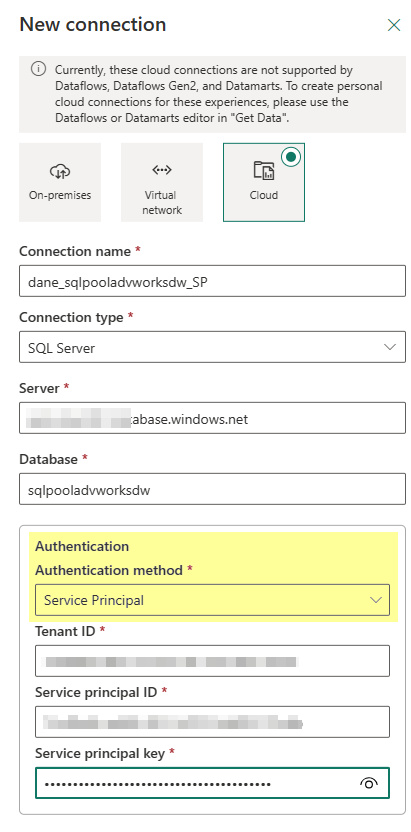
So in the service you click on the Settings gear icon in the top right and select Manage connections and gateways. From there you will click on the +New button in the top left and then configure your Cloud connection like such and you will see under the authentication method you can choose Service Principal!
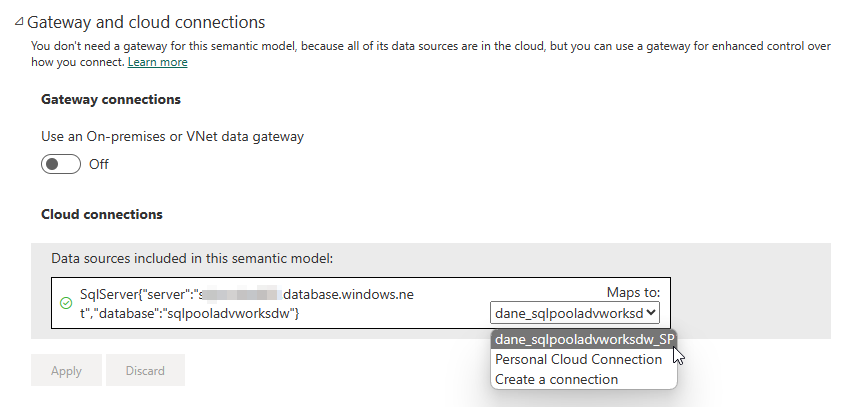
Once you upload your report that is using the similar connection all you need to do is modify the dataset (semantic model) settings and adjust the reference from the personal cloud connection to the shareable cloud connection that you created which is using the Service Principal like in the following screenshot.
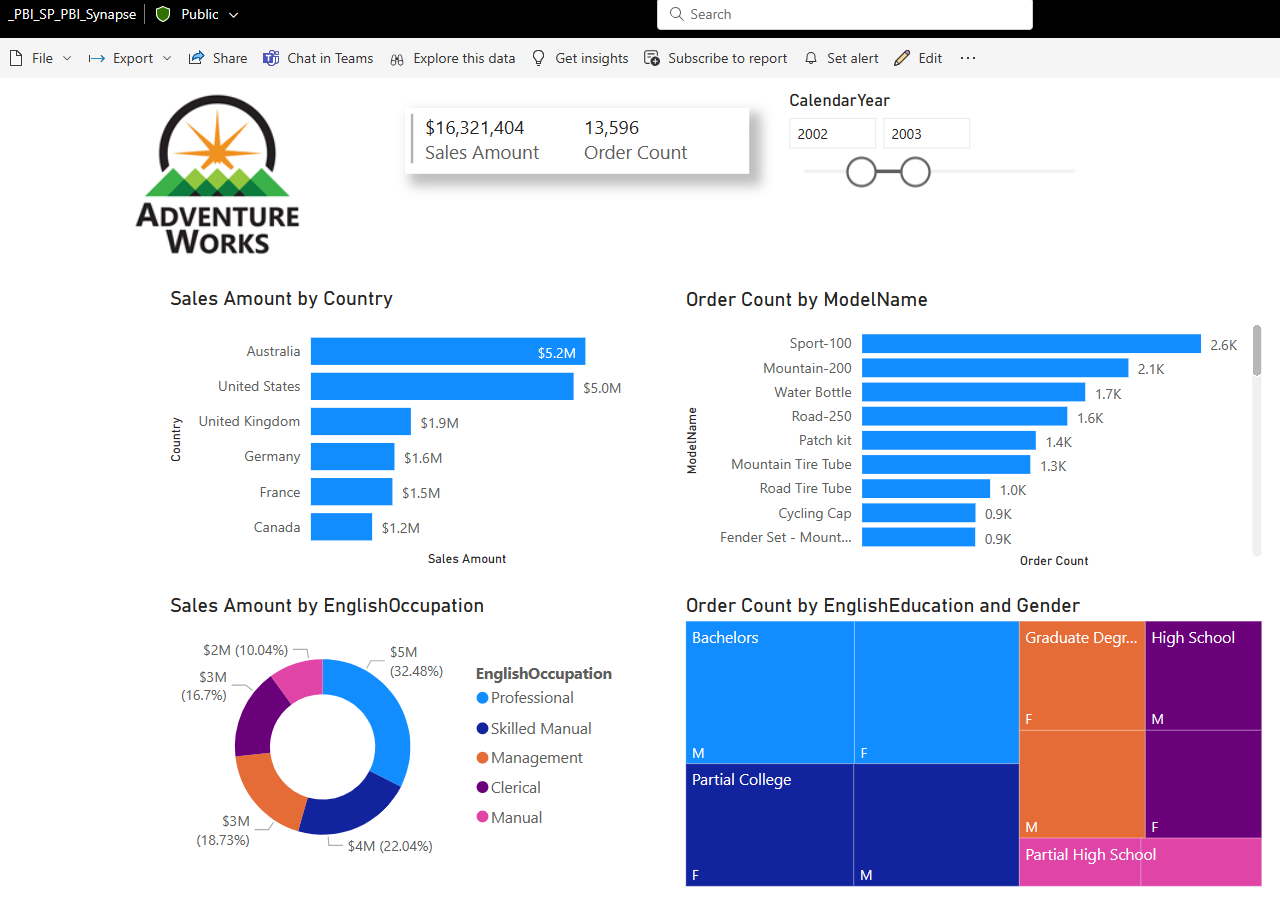
Once that is done you can go back and view your report and everything is good to go!
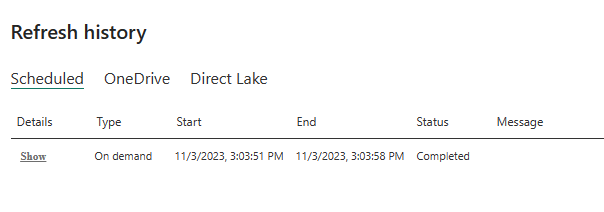
And you can go ahead and do your refreshes just like you would normally:)
In this post I just wanted to show the ability to use the Delta Lake format that is very common now with Power BI. I will go over a quick example of creating the files to reference, building a view to use with Power BI, and then querying the data in Power BI.
In my Synapse Workspace I created a Linked service connection to an Azure SQL Database that has the AdventureWorksLT database loaded which is the sample database you can create when you first create a SQL instance in Azure and here is a walkthrough link and see the Additional settings section.
I am going to use this database as the source to generate the Delta Lake format files in an Azure Data Lake storage account. To do this I created a Data flow in my Synapse Workspace and referenced two tables as my source, one being the Product table and the other the Product Category table. Really basic example, just really want to highlight the ability to easily reference the Delta Lake format files that are in the storage account within Power BI.
Synapse Data flow screenshot
On the source side I am referencing the Linked server connection that I already established against the AdventureWorksLT sample database in Azure SQL as you can see below in the Source settings and above you can see I am actually providing a query to simply extract just the columns I am interested in on the Source options tab.
Synapse Data flow source settings screenshot
This setup is done for both the sources in the Data flow and then on the sink side the target destination is going to be an Azure Data Lake storage account. For the Inline dataset type I specified Delta.
Synapse Data flow sink screenshot
And on the sink settings tab you just need to provide the folder path and compression information as shown below for where the product table Delta Lake files will land.
Synapse Data flow sink settings screenshot
After the Data flow is configured and in this example I am just doing the Product and Product Category tables then add the Data flow into a Synapse Pipeline and Trigger the Pipeline to run to create the files in the Azure Data Lake. After you add the Data flow activity to the Pipeline you just need to configure the settings as shown below and then under Add trigger do the Trigger now option. This should just take a few minutes to run to queue the job and spin up the resources.
Synapse Pipeline Data flow screenshot
Now in the Synapse Workspace I can go into the Data hub and view the files that are in the linked data lake storage account as shown below.
Synapse Data hub linked data lake screenshot
With the files in the Azure Data Lake we are now going to reference these with the Synapse Serverless Pool. To make it easier to reference these in Power BI I will actually create a view that combines the data from both tables to include the columns of information that I want for my report. The first thing will be to create a database in the Synapse Serverless Pool and this will store the view that we will reference in the report.
Synapse SQL Serverless script screenshot
In the screenshot above I have the script to create the database. After that gets created as you can see in the screenshot in the top-right I connect to that database and then that is when the script to create the view is run.
If you query the view or run the SELECT statement above you will see the results as shown below in the screenshot.
Query results from Delta Lake format files in ADLS screenshot
In Power BI Desktop now you can Get Data and by using the Synapse Serverless SQL endpoint that you can get from the Azure portal on the Synapse Workspace Overview page you can make a connection to the servless_ondemand database we created and select the vwProductCategory view to include in the report.
Power BI Desktop Get Data Synapse Serverless SQL screenshot
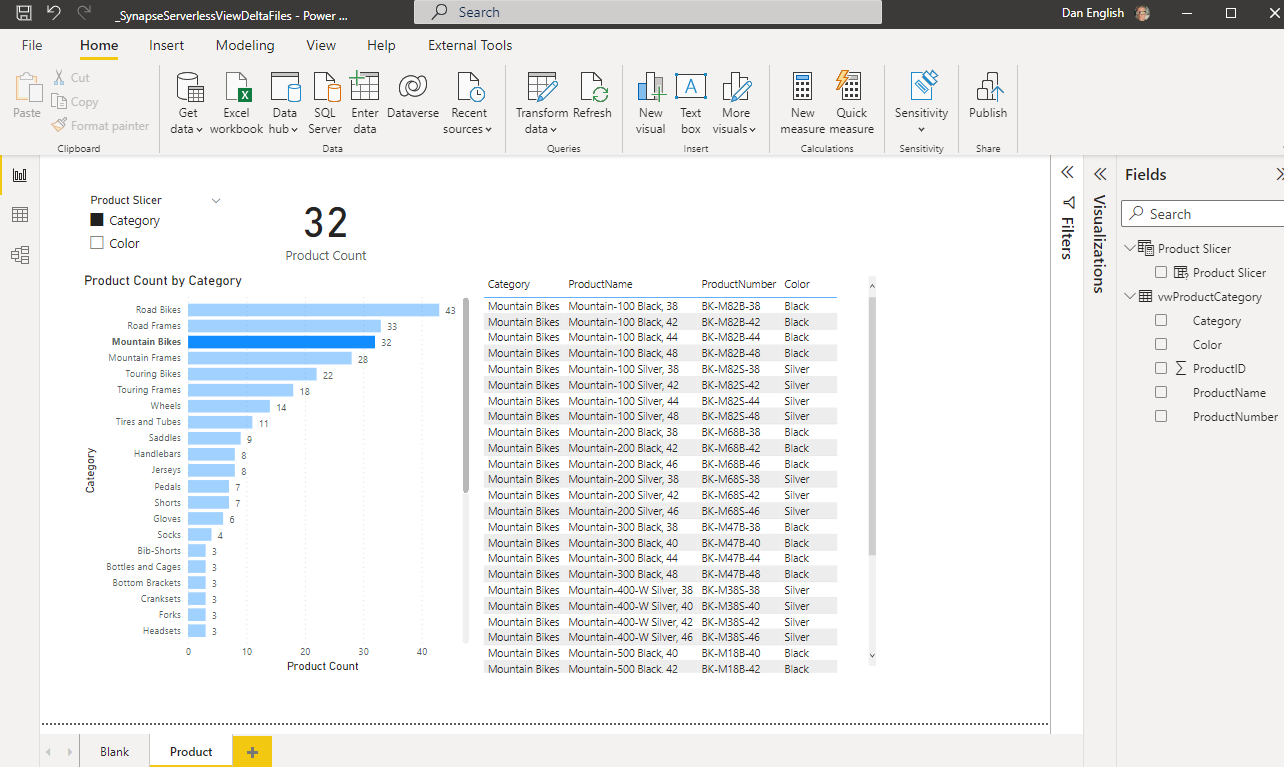
By know means is this a great end to end example, just simply show casing the ability to reference the Delta Lake format files in Power BI, but you can create a report and in DirectQuery mode query and interact with the information that is in the Azure Data Lake with Synapse Serverless Pool that is stored in Delta Lake format!
Power BI Desktop report screenshot
This was a pretty brief overview, but hope you can see the possibilities of using the Synapse Serverless capabilities to easily reference the data in an Azure Data Lake and query the data directly using Power BI and in doing this we even created a view that joined the data from two different tables (files) in the lake!
In my last post I went over using a Service Principal account to access a Synapse SQL Pool with Power BI. I even showed how you could go across different tenants in my example. In this post instead of going against a SQL Server source I am going to switch to a Synapse Data Explorer (Kusto) Pool. Once again we will use the SQL Server ODBC driver just like we did in my last post.
For this post I will be using the same Service Principal and driver that we used in the previous post, so if you need any guidance with that or link to download the driver please reference that post here.
For the example that I will present here I will be do the following:
Create a Synapse Data Explorer Pool and load data
Grant the Service Principal account permissions to the Synapse Data Explorer Pool database (NOAA Storm Events data)
Configure the ODBC System DSN to access the Synapse Data Explorer Pool
Create a dataset and report using the ODBC source connection in Power BI
Publish the report in a different tenant than the Synapse Workspace
Configure a gateway to use in the Power BI service with the dataset
Refresh the Power BI dataset and view the report in the service
As mentioned I will be reusing some of the items that were covered in the previous post, the only difference is that we will be going against a Synapse Data Explorer (Kusto) Pool. If you are already familiar with Azure Data Explorer (ADX) you can review the document here to see how these compare.
First step will be to create the Synapse Data Explorer Pool within the same Synapse Workspace we used in the previous post with the Synapse Dedicated Pool. This can be done in a few different places within the Azure Portal (Synapse Workspace Overview page or Analytics pools section) or in the Synapse Studio (Data or Manage Hub). In this example I am doing it in the Azure Portal and simply click the New Data Explorer Pool option in the Synapse Workspace Overview page and complete the required information.
Create Data Explorer Pool configuration screenshot
I didn’t make any other setting changes and simply created the pool, this will take a few minutes to complete (approximately 15 minutes for me). In the meantime I have decided to use the NOAA Storm Events data which is a sample you will explore if you doing any of the Kusto Query tutorials on the Microsoft Learn site. I went ahead and downloaded all of the StormEvents_details files (73 of them) and extracted them to a folder on my laptop (1.31 GB total).
Once the pool is created on the Overview page you will be presented with a wizard that you can complete to create the initial database and load data.
Synapse Data Explorer Pool wizard screenshot
Simply click the Create database button, enter a database name and set the day settings, and then click Create.
Data Explorer Database creation screenshot
Creating the database will not take long and after you click the Refresh button on the Overview page you will be at Step 3 – Data Ingestion. Click on the Ingest new data button which will then launch Azure Data Explorer window with a connection to the newly created database. If we right-click on the database we can select the option to Ingest data which will launch us to another wizard to name the table, provide the source, set the schema, and then ingest (load) the data into the new table.
Azure Data Explorer Database screenshot
Provide a name for the new table on the Destination page and then on the next page in the wizard we will set the source.
Ingest New Data Destination screenshot
For the Source page you can simply drag and drop the 73 storm event csv files and it will start to upload them which will take a few minutes to complete (approximately 8 minutes for me). Next you can go to the Schema page and review what was done based on analyzing the data.
Ingest New Data Source screenshot
Go ahead and review the Schema page to how the data was mapped if you want and then click on the Start ingestion button.
Ingest New Data Schema screenshot
Now the storm events data will be loaded into the table and this will take a few minutes to complete but should go relatively quickly and once this is done you will see a Data preview.
Ingest New Data screenshot
Now we are ready to move on to the second step and grant the Service Principal account access to the database. This can be done at the cluster level or database. In the Azure Portal within the Data Explorer Pool Permissions page you can add the Service Principal to the AllDatabasesViewer role.
Data Explorer Pool Permissions screenshot
Or in Azure Data Explorer in the Query tab with the connection to the new database you can use the following syntax –> .add database <databaseName> users (‘aadapp=<application id>;<tenant id>’) ‘<app name>’ as shown below
The third step is to create the ODBC System DSN which is pretty similar to how we did it for the Synapse Dedicated SQL Pool, but there is a slight twist which took me awhile to figure out and had to go into the registry to make a modification to the ODBC entry🤓
Just like we did in the previous post we will go into the ODBC Data Source Administrator (64-bit), click on the System DSN tab, and click Add. As before use the same ODBC Driver XX for SQL Server, click Finish, enter a name for the DSN, and then provide the Data Explorer Pool connection information which in this case will be in the format of <pool name>.<workspace name>.kusto.azuresynapse.net and you can get this from the Overview page of the Data Explorer Pool in the Azure Portal. It is the URI information and simply remove the “https://” information.
First page of the System DSN configuration screenshot
On the next page just like before we will select the option for Azure Service Principal authentication, provide the application id for the Login ID, and then click Next. There is no need to put the Secret Value yet for the Password because we need to simply create the entry first in the registry to modify it and then we can come back in with the password to do an official test.
Second page of the System DSN configuration screenshot
On the next page you can go ahead and set the default database setting and then click Next.
Third page of the System DSN configuration screenshot
On the next page you can click Finish and then OK. Now if you would have provided the Secret Value and then tried to test the data source connection you would have been provided this message about “No tenant identifying information found in either the request or implied by any provided credentials” as shown below.
Data Source Connection Error screenshot
This is what we are going to fix in the registry and it took me awhile to track down the solution and thanks to this article here on MS-TDS clients and Kusto I determined how to include the tenant information into the “Language” field in the ODBC data source🤠 Once you have created the System DSN you need to use the Registry Editor to add a new String Value to the ODBC entry called “Language” with the “any@AadAuthority:<tenant id>” format as shown in the link above.
Registry Editor ODBC Language screenshot
Now if you switch back to the ODBC Data Source Administrator you can configure the System DSN that was created to include the Secret Value for the Password and then as you click through to the final page you will see the language information included now based on what you entered into the registry.
System DSN Configuration Language screenshot
And when you go to Test Data Source now you should see (fingers crossed) a “TESTS COMPLETED SUCCCESSFULLY!” message.
System DSN Test Data Source screenshot
The fourth step now is the easy part, just like we did in the last post, open Power BI Desktop, use the ODBC connection, and connect to our Kusto database to create our dataset.
Power BI Desktop Get Data ODBC screenshot
There is just one table so this is pretty easy. We can clean up the column names to make them more readable, add measures, hide columns that are not needed, etc. and then build out a report. As you can see below in the report we have over 1.7M records loaded and the size of the Power BI file once all of the data is loaded is 188 MB which is much less than the 1.31 GB of CSV files👍
Power BI Storm Events report screenshot
For the fifth step now we simply need to publish the report to the Power BI service which is straight forward and just like the last post and so is the sixth step where we configure the gateway connection once published to include the new DSN data source. Just remember to replicate the ODBC configuration that we did above on the gateway machine that is being used by the Power BI service.
Dataset settings Gateway Connection screenshot
Just make sure to follow the same steps as the last post and reference that if you have any questions.
For the final step you can now go ahead and test everything out by running the dataset refresh and then viewing and interacting with the report.
Dataset Refresh history screenshot
And if we interact with the report everything should be good and just remember once again this demo like the last post is going across tenants using the Service Principal account.
Power BI report screenshot
That completes this post covering the topic of being able to use a Service Principal account to connect to Synapse Data Explorer Pool for a Power BI report.
Let me know what you think and thanks for checking out this post, I hope you found this useful:)
In this post I will go over a topic that is frequently asked about and that is using a Service Principal account with Power BI when connecting to data sources. Currently today none of the built-in connectors support this capability natively, but the SQL Server ODBC driver does support the use of a Service Principal account. The one caveat with using an ODBC driver with Power BI is that a gateway would be required once the report is published to the service.
For the example that I will present here I will be do the following:
Create a Service Principal account (App Registration) in Azure
Grant the Service Principal account permissions to the Synapse Workspace Dedicated SQL Pool database (Adventure Works DW schema)
Install and configure the SQL Server ODBC driver (including the System DSN)
Create a dataset and report using the ODBC source connection in Power BI
Publish the report in a different tenant than the Synapse Workspace
Configure a gateway to use in the Power BI service with the dataset
Refresh the Power BI dataset and view the report in the service
As noted above in this example not everything will be in a single tenant, so that is a slight twist and I have worked with customers where this type of a configuration was needed. This means that the database will reside in one Azure tenant and the report and dataset will be in another and everything will work.
First step is to create the Service Principal account in the Azure portal. In Azure Active Directory in the portal you will go into App registrations and pick the option to add a New registration. When you create the new account this is where you can determine if it can be used multitenant or not and in my example that is what I selected.
New App registration screenshot
Once that is created in the new App registration you will need to create a New client secret which will be used as the password when connecting to the database for authentication purposes. When creating the secret you can determine when it will expire as well.
Adding a Client Secret to App registration screenshot
Once you create this you will want to copy the Value for the client secret and store this in a secure location, that will be the password we will use later. The other item that you will need to capture that will be used as the Login Id or the User Name when connecting to the database is the client Application ID and you can get that guid value on the Overview page for the App registration you created.
App registration Application ID screenshot
The second step is to grant permissions for the Service Principal account to be able to access the database. You can run the following script once you are connected to the database and in this case I am using a Synapse Dedicated SQL Pool database where I have loaded the Adventure Works DW database. Whether you run the script in the Synapse Workspace or using SSMS or Azure Data Studio it will all work the same.
SQL Scripts to add Service Principal user and grant permission screenshot
The third step now is to download and install the SQL Server ODBC driver (I will be using the 64-bit which will be required on the gateway to work with the service) and then configure the System DSN. If the machine you are using doesn’t already have the Visual Studio C++ Redistributable runtime libraries installed that will be required for the driver install.
Once the driver is installed then you can launch the ODBC Data Source Administration (64-bit), click on the System DSN tab, click the Add button, select ODBC Driver XX for SQL Server, and click Finish button.
There will be quite a few screenshots showing the configuration of the System DSN. The first page in the wizard is pretty straightforward provide a name for the DSN and provide the SQL Server instance name (you can see in my example below we are connecting to a Synapse database.
First page of the System DSN configuration screenshot
The next page is where the hidden Easter egg is where you can select the Azure Service Principal authentication. This is where you will put provide the Application ID and the Client Secret Value for the Login ID and Password.
Second page of the System DSN configuration screenshot
The next page is where you can provide the default database name you will be connecting to and after this you can click through until the end where you get a change to test the connectivity.
Third page of the System DSN configuration screenshot
The last page is where you can test the data source connectivity and if you did everything as expected you should see the “TESTS COMPLETED SUCCESSFULLY!” message.
Final page of the System DSN configuration to test connectivity screenshot
Once you have completed this configuration wizard and the connectivity worked successfully you will then see the new System DSN added as shown below.
System DSN added in ODBC Administrator screenshot
So far so good, we are about half-way through the process;)
The fourth step is to open Power BI Desktop and Get Data using ODBC option as shown below.
Power BI Desktop Get Data ODBC option screenshot
For the ODBC Data source name (DSN) you will provide the name you entered when creating the System DSN in the previous step.
ODBC data source name screenshot
Once connected with the System DSN you will then be presented with the Navigator as shown below to search and browse the database.
Navigator view of the ODBC connection screenshot
Now simply select the tables that we want to include in our data model and in this example I selected five tables, four dimension tables and one fact table.
Select tables for data model screenshot
After I selected the tables I went through the transform steps keeping the columns that I wanted to use in the report or for the relationships and renamed the tables. Once the data was loaded I then verified the relationships and created a few measures as well hid some of the columns. I then quickly put together the report below, nothing fancy by any means.
Power BI report using ODBC data source screenshot
The fifth step is simply publishing the report to the Power BI service and in this particular case I decided to deploy this to my demo tenant versus my primary organizational tenant. To do this I made sure in Power BI Desktop to login with my demo tenant account and then publish the report. For this there isn’t much to show, simply switched the account I was logged into within Power BI Desktop and then published the report.
The sixth step is getting the gateway ready which will be needed since I am using an ODBC data source. In my demo tenant I already had a virtual machine already available in my Azure subscription, so I went ahead and started it up, remoted into the virtual machine, downloaded and installed the SQL Server ODBC driver, and then configured the System DSN just like we did in the previous steps above.
Once the virtual machine was configured and running the next thing to do is to review the settings of the dataset that was deployed with the report in the previous step and specifically we want to look at the Gateway connection as shown below.
Dataset settings Gateway Connection screenshot
In the above screenshot I selected the action arrow on the gateway I configured with the ODBC driver and for the data source in the dataset clicked on the link to Add to gateway option. This will then open up a dialog to add a new data source to the gateway as shown below where you will need to add a Data source name and for authentication provide the Application ID and Client Secret Value again for the Service Principal account. Once you have done this you can click Create.
Create ODBC data source in Gateway screenshot
Once the data source has been added to the gateway then we simply need to map this in the Gateway connection, click Apply, and then we can proceed to the next step of running the data refresh!
Map Gateway connection to Data Source screenshot
The seventh and final step is to run the dataset refresh and view the report to make sure everything is working as expected. After running the on-demand refresh and reviewing the dataset refresh history in the settings we see it completed successfully!
Dataset Refresh history screenshot
And then if we view the report and interact with the slicers and visuals we can see everything is working as expected.
Power BI report screenshot
That completes the post covering the topic of being able to use a Service Principal account to connect to a data source for a Power BI report. Currently the only option that I am aware of is the one I have shown, which is using the SQL Server ODBC driver. In this example I used it to connect to a Synapse Workspace Dedicated SQL Pool database located in one Azure tenant and run a report and dataset that was published in a separate tenant.
Let me know what you think and thanks for checking out this post, I hope you found this useful:)


 Subscribe to Blog feed