Dan English's BI Blog

Welcome to my random thoughts in regards to Business Intelligence, databases, and other technologies

Posts Tagged ‘power view’

Installing Power BI Designer Preview Experience

Posted by denglishbi on December 18, 2014

Today Microsoft announced the new Power BI features including the new Power BI Designer tool that provides a separate downloadable standalone application that can be used for Power BI features such as Power Query and Power View!  This is completely separate from Excel – now users can connect to data, relate data, create reports, and also import them to Power BI dashboards to share!

imageimage

imageimage

imageimage

image

imageimage

imageimage

image

So in this example I was able to connect to an existing Excel file I had with some preloaded data (Customer and Geography tables), relate the data (queries) together, create a report (as you can see there are new visualizations available such as treemap, gauge, filled map, funnel, combo chart, etc.), and save the file locally (pibx file extension).

Now that I have a Power BI file with a report I can go to the Power BI Dashboard site and upload this file to share the content.

image

image

Once you get the report loaded you can then continue your design experience, pin items to a dashboard, and share (within your own organization for now)!  All of this is done in HTML5, so no worries about Silverlight.

Quite a few of the new visualizations are not supported to be pinned yet, but at some point they will, so hold on.

image

image

Very cool, a whole new user and sharing experience!

There is also a ton of great help and support documentation, videos, and walkthroughs available as well

image

Enjoy and thanks to the Power BI team!

Posted in Power BI | Tagged: , , , | 1 Comment »

Installing Data Explorer Preview & Demo with IMDB Data

Posted by denglishbi on March 4, 2013

I can’t believe it has been over a year since I posted about Data Explorer in my post Installing Data Explorer Desktop Client.  That was covering the initial release of the client plugin that used the cloud based service from SQL Azure Labs.  Now there has been a considerable amount of work done and there is a public preview of the new COM Add-In you can download and use in Excel. 

Let’s take a look at the requirements:

Systems Requirements

Supported Operating Systems: Windows 8, Windows 7, Windows Vista, Windows Server 2008

  • requires .NET 3.5 SP1 or greater
  • Office 2013 or Office 2010 SP1

You can download the 32 or 65-bit version of this from the Microsoft Office area – Download “Data Explorer”.

image image image


image image image

Here you can see the download loading in Excel 2010.

image 

Here is the add-in being displayed in the ribbon along with the options that are available.

image

Version: 1.0.3207.2 (published 2/25/2013)

image

Now I am going to switch over to Office 2013 because once I get the data loaded into Excel I want to use Power View:)

image

Every time I tried to install the .NET 3.5 framework feature on my Windows 8 machine as well as download and install it from the URL specified I kept receiving the message that it was not able to install and returned the error code 0x800F0906.  I did a little searching and came across this KB article from Microsoft:

Error codes when you try to install the .NET Framework 3.5 in Windows 8 or in Windows Server 2012

I mounted my Windows 8 software and ran the following command to install this feature:

Dism /online /enable-feature /featurename:NetFx3 /All /Source:d:\sources\sxs

(where the ‘:d:’ is the drive letter for the Windows 8 media)

Here are the results of running this to get the framework installed from the command prompt:

image

Once that was finally setup I was able to install the add-in and it was available to load in Excel 2013 (and I am using Office Professional Plus 2013).

image

A little different experience for me with Excel 2013 instead of Excel 2010, I had to go into my COM Add-Ins and enable “Data Explorer”. Where as previously in Excel 2010 it was installed and enabled.

image

Here is the ribbon layout in Excel 2013, same as in Excel 2010.

image

For this example I am going to use the Get External Data->From Web option and tap into some information on the IMDB web site.

image

IMDB Charts: IMDb Top 250 – http://www.imdb.com/chart/top?ref_=nb_mv_3_chttp

Here is what the web page looks like that I am going to extract data from:

image

After I click apply the Query window opens and I can see what is available for me to access, in this case I am interested in Table 0.

image

NOTE: it would have been super cool if the hyperlink URL reference that was on the web site for the movie titles was included in this table, unfortunately it was not, so that forced me to do a little more additional work later on to enrich my data for Power View.

I am going to right-click on the Title column and split the column into two since the year the movie was released is included.
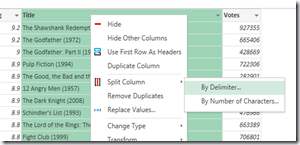
image

To split the column I am going to use a custom delimiter of a space and left parenthesis.
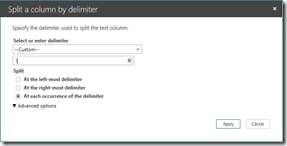
image

Now you can see the new column that was created and I have two columns, Title.1 and Title.2

image

Now I am going to cleanup the Title.2 column and replace the right parenthesis.
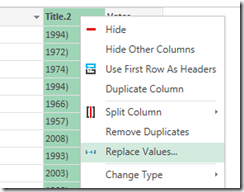
image

I will replace the right parenthesis with nothing and apply that change.

image

Now you can see the Title.2 column is cleaned up.

image

I am going to quick browse the values just to verify this and wouldn’t you know, I found one more item that needs to be evaluated.

image

I filtered for just the records with the 2011/I values and one record is displayed for “The Artist”.

image

I take a quick look at that move on IMDB and I see that after the title there is that additional (I), so that must be causing the issue.

image

So I will add another replace condition on the Title.2 column to cleanup that record and replace /I with nothing.

image

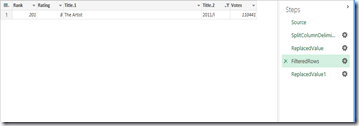
The next thing I need to do is take a look at the Steps pane on the right-hand side and you can see the trail of steps that I have performed so far.  You can review them and in this case I am going to go back to the FilteredRows step and delete that step to remove the filter.
image

I get a warning about deleting a step in my process letting me know that it could impact subsequent steps, but I am okay with that.

image

Now we have my final dataset that I want to work with and this gets added into a new worksheet in Excel once I click Done in the Query window.

image

Now with a little of additional work with help from some calls out to the Internet and VBA we can get some additional information about these movies and make a Power View report like this (I made some additional adjustments to the model in PowerPivot as well, but this is more about Data Explorer, so we will skip that side of things):

image

The Rated ‘R’ movies have the most votes and you can see they have the top ranked moves as well by looking at the card layout.

By clicking on PG-13 in the bar chart in the middle we can filter the entire report – cards, summary data at top of report, as well as the column chart.

image

Based on the top 250 ranked movies from IMDB we can see that the average PG-13 movie has a rating of 8.2 and “The Dark Knight” has the highest rating of 8.9 with over 900 thousand votes.

I tracked down one of my favorite movies, “The Matrix”, and it was ranked 19 with an overall 8.7 rating.

image

We can also see down below that starting in the 60’s, the ‘R’ rated movies started to gain some traction and as the years go on those are the more favored movies, quite the difference compared with earlier decades where it was dominated by the ‘Approved’ rating, but maybe ‘R’ was not even a classification back then.  More than likely if we had some demographic information on the voters we would probably see some correlation with that as well.

image

That is it for now, a quick preview of the install process as well as tapping into some data from a web URL, which in this example was IMDB.

You can check out some Getting Started, Tutorials, and How-to information here – Data Explorer Help.

Posted in Data Explorer | Tagged: , , | 5 Comments »

Presenting Power View Reports to Users

Posted by denglishbi on October 17, 2012

As you begin to use the new Power View reporting feature that is available with the Reporting Services 2012 integration in SharePoint 2010 one of the things that you will need to assess is how you are going to allow the users to access the reports.  What are the different options that you have when providing access to the Power View report files (rdlx) in SharePoint?

Here is a list of options that you could use:

  • store the Power View reports in a Document Library
  • display the Power View reports in a PowerPivot Gallery
  • use a Page Viewer Web Part to display the Power View report
  • use a Silverlight Web Part to display the Power View report

Here is how each of these will look to the end-user that will be access the reports:

Document Library

image

Above we can see that the Power View report files are available and stored in a document library, nothing really fancy, just storing the rdlx files.

PowerPivot Gallery

image

The PowerPivot Gallery is a very nice option to display the Power View reports. Provides a nice visual display of the reports and users are able to see if additional views are included in the files as well.  The view I have displayed above is the default Gallery setup, but additional options are available such as just displaying the files in the document layout like the Document Library display in the first example, Theater, and Carousel.

Page Viewer Web Part

image

The Pager Viewer web part is a nice option to include a Power View report (or a particular view) on a page.  This is a nice option to include a Power View report into any existing page and to provide a nice controlled output of the report.  You can see that the ‘Preview Bar’ has been removed from the top of the report so a user is not able to access the ‘Edit Report’ option.  The users are still able to interact with the report and access the different views in the report as well.

image

How do you configure the Page Viewer web part?  Pretty basic and a bit easier than the next option that will be looked at.

  1. Create a web part page
  2. Add a Page Viewer web part to the page
  3. Specify the URL path along with additional parameters for the report
  4. Specify the height and width for the web part for the appearance

Here is what the Page Viewer web part settings look like for the example displayed above:

image

Here is the URL path that I have specified along with some additional parameters that I am setting to provide the desired output:

/_layouts/ReportServer/AdHocReportDesigner.aspx?RelativeReportUrl=/Shared%20Documents/Hotel%20Performance%20Dashboard.rdlx&ViewMode=Presentation&ReportSection=ReportSection2&True&Fit=True&PreviewBar=False

In this example I am setting the View Mode, the Report Section I want to display, and hiding the Preview Bar.  These are the core settings that need to be set to get this output.  There are additional settings that you can explore and a few of these I discuss here in the following post URL Actions with Reporting Services Power View (RTM) and as one person commented there are additional parameters available and you can see these by accessing the properties of the output in PowerPoint as discussed here Can i edit my PowerView Report exported to PowerPoint in Presentation Mode? YES YOU CAN.

If we dig into the above output for the Pager View web part we can see that the output is displayed in an iframe and granted just by removing the Preview Bar doesn’t mean that the user couldn’t track down the actual location of the report and launch it from there, so this by no means is a security option.  The user still needs the proper permissions to the Power View report file (Restricted Readers – requires the ability to Open Items and this is different compared to regular Reporting Services reports because of the Silverlight application).

image

Silverlight Web Part

image

The Silverlight web part display looks identical to the Page Viewer.  This option requires a bit more of setup and I have to thank Robert Bruckner for the details on configuring this option.

    1. Create a web part page
    2. Add a Silverlight web part to the page
    3. Specify the URL path to the Silverlight application
    4. Specify the custom initialization parameters (Other Settings)
    5. Specify the height and width for the web part for the appearance

The path to the Silverlight application is the following:

/_layouts/ReportServer/ClientBin/Microsoft.Reporting.AdHoc.Shell.Bootstrapper.xap

The custom initialization parameters that I used in the example above are the following:

ItemPath=http://win-doqtev64aj4/Shared%20Documents/Hotel%20Performance%20Dashboard.rdlx,ReportServerUri=http://win-doqtev64aj4/_vti_bin/reportserver/,ViewMode=Presentation,PreviewBar=False,Fit=True,ReportSection=ReportSection2

The template Robert provided for this setup is the following for the parameters:

ItemPath=http://<YourServername>/<YourSite>/YourReport.rdlx,ReportServerUri=http://<YourServername>/_vti_bin/reportserver/,ViewMode=Presentation,PreviewBar=False,Fit=True

Here is what the Silverlight web part settings look like for my example above:

image

When you add the Silverlight web part to the page you will be prompted for the URL path for the Silverlight application. That setting and address is also available in the above screenshot in the Application settings when you click on the ‘Configure…’ button.

You can once again dig into the output like we did above with the IE Developer Tools (F12) and you will see the following:

image

A little different output here and if you dig around enough you will eventually track down the initialization parameters, so once again not an option to prevent the users from finding out the original source of the file, but it is still an option that you can use to display Power View reports in a web page.

Summary

So to wrap up this post, I just wanted to show the different options you have available in SharePoint to display and provide access to Power View reports to end-users.  The first two options allow the users to launch the reports in the web browser and access the Edit Report or go into Full Screen modes.  I would use the PowerPivot Gallery option because of the nice output and provides the users quick insight as to what is included in the report and an overview of the different views (if more than one exists).  The last two options would be something to explore if you want to include a Power View report on a web page.  This is a nice clean option where we have removed the Preview Bar, but have still allowed the user access to the report to interact and browse the different views.  This could be a nice option if say you want to include a Power View report in a PerformancePoint dashboard.

I hope you have enjoyed this quick overview and for more information on how to use Power View and creating tabular models, don’t forget to check out our book here – Visualizing Data with Microsoft Power View.

Posted in Reporting Services, SharePoint | Tagged: , , | 4 Comments »

Tabular Models, Compatibility Level, and Power View

Posted by denglishbi on October 4, 2012

[tweetmeme source=”denglishbi” only_single=”false”]

A couple of weeks ago I did a review of the CTP4 of SP1 that came out for SQL Server 2012 – Installing SQL Server 2012 SP1 CT4 Experience. Part of my test involved upgrading an Excel 2013 PowerPivot file to a Tabular Analysis Service project.  After I did that I setup a BI Semantic Model connection file in SharePoint and explored the Power View designer updates.  It was business as usual and I was seeing all of the new features and functionality that I had previously mention in my posts on Excel 2013 and Power View – Power View meet Microsoft Excel 2013 and Power View meet Microsoft Excel 2013 Part 2.

Well this past week I was prepping for my pre-con for the SQLSaturday #149 event and I noticed something odd.  When I was connecting to my tabular models with Power View I was not seeing my hierarchies or key performance indicators (KPIs).  I was a bit confused.  I upgraded my environment to SP1, so what was going on.  I thought the upgrade provided support for these model features now, right?  I know I had seen them already, maybe I was just imagining things though.  When I was doing my tabular project deployments I was also seeing a new dialog box that I was just clicking ‘Yes’ on without really understanding what it was talking about…

image

I completed out the pre-con still confused and then last weekend I did a bit more digging into this issue.  I went back to my Excel 2013 SQLSaturday model that I upgraded and I reviewed the property settings on the database.

image

The item that I noticed that seemed like it might be important was the Compatibility Level setting.  This database was showing SQL Server 2012 SP1 (1103).  I then took a look at the database I was using for some of my demos.

image

Ahhh, now the light bulb was starting to get bright:) The database that I was deploying was still in the SQL Server 2012 (1100) setting even though I had upgraded my environment to SP1.  Interesting.  Apparently you have the ability to control this setting now if you want to run in different levels or do some testing in the same environment before upgrading all of your databases.

image

I didn’t realize that I now had to make a change on my model property settings before I deployed my database.

Once this setting is changed you will be prompted with the following:

image

Once again I click ‘Yes’ and redeploy to upgrade the database on the server.  Now when I connect to my model with Power View I see my hierarchies and KPIs, perfect!

image

So just something to be aware of now when working with tabular model projects now.  There is a property setting that we have to take a look at, Compatibility Level, and it is a pretty important one for the users of our data models:)

Here are a couple of additional reference links to take a look at (some of this documentation and instructions might differ from what you see with CTP4 of SP1, but they should be available in the RTM of SP1):

Cheers!

Posted in Analysis Services | Tagged: , , | 8 Comments »

Installing SQL Server 2012 SP1 CTP4 Experience

Posted by denglishbi on September 22, 2012

[tweetmeme source=”denglishbi” only_single=”false”]

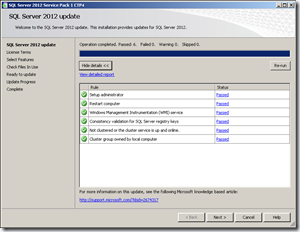
A standalone version of the SQL Server 2012 SP1 was released this week.  It is not the final release, just a community technology preview (CTP4), but a release that we can test out none the less.  The exciting part of this release to me are the enhancements that have been added to Power View.  Here you will see the steps I went through to upgrade my evaluation virtual machine I have setup that is based on the Appendix B that comes with our book – Visualizing Data with Microsoft Power View.

First you will need to download the SQL Server 2012 SP1 CTP and you can do that from here – SQL Server 2012 SP1 CTP (there is even a full SQL 2012 slipstream version you can download as well that includes the service pack).  You also might want to download some of the additional features that are provided with the feature pack and you can get that from here – Microsoft® SQL Server® 2012 SP1 Community Technology Preview Feature Pack.

Once you have the service pack downloaded you can run this on your machine and follow through the screenshots below.
 

image

image

image

image

image

I had one item that I needed to shutdown so that I could avoid a restart after I installed the service pack and that was related to IIS services (these are running because of SharePoint 2010).

image

So I had to stop the IIS Admin Service and the World Wide Wed Publishing Service.

image

I did a refresh check and I was good to go.

image

Running RTM Evaluation Edition – 11.0.2100.60

image

Updating the default instance of SQL 2012

image

Updating 2nd instance of SQL 2012 (POWERPIVOT)

image

Instance MSSQLSERVER overall summary:
  Final result:                  Passed
  Exit code (Decimal):           0
  Start time:                    2012-09-22 08:15:42
  End time:                      2012-09-22 08:33:33
  Requested action:              Patch

Instance POWERPIVOT overall summary:
  Final result:                  Passed
  Exit code (Decimal):           0
  Start time:                    2012-09-22 08:33:57
  End time:                      2012-09-22 08:35:24
  Requested action:              Patch

Patch Level: 11.1.2845.0

image

Verify I can connect to my instances of the database engine and Analysis Services along with reviewing the build numbers.

Microsoft SQL Server 2012 – 11.0.2845.0 (X64)
    Sep  1 2012 02:36:04
    Copyright (c) Microsoft Corporation
    Enterprise Evaluation Edition (64-bit) on Windows NT 6.1 <X64> (Build 7601: Service Pack 1)

Now to go start into SharePoint and check out Power View!

image

New Ribbon layouts, icons, and features (images, hyperlinks, field list control)

image

More style, text, and background options

image

New visualizations – Pie and Map charts along with font sizes

image

Pie Charts, but no data labels or sorting options.

image

Bing geo-encoded maps

image

Pre-defined drill up/down capabilities

image

Support to restore Excel 2013 PowerPivot files in Tabular SSAS

image

SQL Saturday #149 is coming up next:)

image

SharePoint 2010 will not support the Power View that is in Excel 2013 files.

image

I noticed that my PowerPivot was not working yet, so need to run the PowerPivot Configuration Tool.

image

image

New version detected, time to upgrade.

image

Run the upgrade process.

image

After this is done we go back in and test out PowerPivot again

image

Now it works just fine.  The one thing I noticed is that it doesn’t appear to be working with the Excel 2013 PowerPivot files though.

image

Maybe these will not work in SharePoint 2010, not quite sure yet, will need to look into this more.

For more information on the new features available in the updated version of Power View check out some of these references:

Here are some more links for information on the SP1 updates:

This service pack also includes performance improvements with slicers and filters with PowerPivot and Tabular SSAS as well as I demoed here in this post and video – Excel PowerPivot SQL 2012 vs. Excel 2013 Performance Demo.

Now we just need to wait for the final release and hopefully that will be coming out in a couple of months now, should be very soon. Enjoy!

Posted in SQL Server | Tagged: , | 23 Comments »

Using PowerPivot Model Images with Excel 2013 Power View

Posted by denglishbi on September 13, 2012

[tweetmeme source=”denglishbi” only_single=”false”]

As you have heard and possibly seen in my other Excel 2013 posts, Power View is coming to the Office suite.  This is great news to everyone that uses Excel.  The one thing you might be curious about is how to include and reference images within your data model.  This post will cover the options that you have and provide a few screenshots of the process.

Database Images

If you are working with data that resides in a database and the images are stored in the database table you will be able to work with them once you load the data into your data model within PowerPivot.  This hasn’t changed at all, the only thing that has changed is that now you don’t have to upload your PowerPivot file into SharePoint to create the Power View report.  Instead you can simply insert a new Power View report and create your reports.

Here is a quick look at this type of a setup.

First the database tables have to be in place.  In this example I am going to reference two different tables that will have images in them, one for authors and the other for books.

image

Once the records have been added to the tables we just need to add the images and one way to do this is with some T-SQL and OPENROWSET command as displayed in this blog post here – Insert binary data like images into SQL Server without front-end application.

image

Once the data is in place we need to create our model, so we will open up Excel 2013, go into the PowerPivot window, load the data into our model, define relationships, and do some advanced setup on our tables.

Let’s take a quick walkthrough of this process if you are not familiar with this yet.

image

Once you have activated the PowerPivot add-in in Excel 2013 you will be able to select that tab in the ribbon and manage your data model.

image

Once you are in the PowerPivot window you will be able to get external data and import data into your model.

image

Select the tables you want to work with in your model.

image

Import the data.

image

Switch over to Diagram View and drag-and-drop the fields to establish relationships between the tables.

image

Select the Author table and define the Table Behavior so you can define the default label and image for each record.  Do the same for the Book table.  Now that you have that setup one last step you can do before you start to use the model is to perform some cleanup.

image

Here we have hidden the two row identifier columns in each of the two main table and also hid the reference table that relates the two tables.  You can do this by simply right-clicking on the items and selecting ‘Hide from Client Tools’ from the context menu.

Now you can switch back to Excel and from the Insert tab in the ribbon select Power View.

image

Now we will see the two tables in our model and the item that we are particularly interested with is that the Photo column is available and the key step was the configuration step in the Table Behavior.

image

Now we can select the items in the field list and start to put together a report such as this –

image

Web Server Images

Another option you have for referencing images in your Excel PowerPivot model is to store the image files on a web server.  The one thing that you need to make sure is that the web site is setup with Anonymous authentication and users have permissions to the file location.  Once that is setup you can establish a URL reference to these images files in your table within your model.  After the URL is configured you will need to review the advanced settings just like the database image setup so that you can reference the images in your Power View report.

Let’s take a quick look at the difference here.  First we have the anonymous web site.

image

Then we place the files on the web server to reference in the location we defined for the web site.

image

Make sure that users have access to the location.

image

Now we go through the similar steps as we did in our first example, but after we define our relationships we need to go back into our tables and define the URL paths for our images.

In both tables we will create a calculated column called PhotoURL and with some DAX setup the paths to the images.

image

image

The secret here is to make it data driven, if you are not able to do this then you would need to store the URL values in the source table and import them.  Luckily with a little DAX we could setup a formula that will work for each record.  Now if someone wants to replace one of the images on the web server they can do so and it would be reflected in the report with a refresh.

The next step is to go into the Table Behavior like we did in the previous walkthrough and make reference to this new column for our default image.

image

Once this is done we can go ahead and switch back to Excel and create a Power View report, just like we did previously.

The one thing to note here is that when you switch over to the PhotoURL reference you will be prompted with a security warning about accessing external pictures.  Go ahead and click ‘Enable Content’.

image

Now we can look at our same report –

image

Only this time we are using the PhotoURL versus the Photo field.

image

Conclusion

And there you go, two different options for referencing and using images within your Excel 2013 Power View reports.  Using the web server setup is nice because then you can swap out the images a bit more easily, but you still have the option to store the images in the database if that is how you where you want to keep them. 

Now go ahead and try this on your own and really spice up your reports with some nice images:)

Posted in PowerPivot, Reporting Services | Tagged: , , | Leave a Comment »

Visualizing Data with Power View: Pan-Geo goes PowerPivot

Posted by denglishbi on August 9, 2012

[tweetmeme source=”denglishbi” only_single=”false”]

Back in June we released our book on Power View, Visualizing Data with Microsoft Power View.  Not only does the book contain great information about creating reports with Power View, but it also contains content on building tabular models that can be utilized with Power View.  The current release only works with tabular models, so either PowerPivot or Tabular Analysis Services (SSAS).  With our book we primarily focused on building out a Tabular SSAS solution that gets used for the majority of the Learn By Doing exercises.  Sure there are a few times where a PowerPivot file is referenced or we do some initial modeling in PowerPivot, but most of the work gets done with the tabular solution that gets deployed to Analysis Services.image

Well just a few weeks ago when Office 2013 Preview was released I decided to build out the entire Pan-Geo Hospitality & Travel model in PowerPivot.  I went ahead and replicated all of the exercises that we did in the tabular project into PowerPivot (using Excel 2010 and the SQL 2012 PowerPivot add-in).  I then took that same file and upgraded it up to Excel 2013 as well – Power View Meet Excel 2013.

image

So since I took the time to build this out I decided why not go ahead and share:)

If you are interested in Power View and especially if you have already purchased the book (hint, hint) I have gone ahead and uploaded the two Excel files to my SkyDrive here – Power View Book.

  • PGHT Tourism PowerPivot Model 2010.xlsx (Excel 2010 uses the SQL 2012 PowerPivot add-in)
  • PGHT Tourism PowerPivot Model 2013.xlsx (Excel 2013 uses the PowerPivot for Excel 2013 add-in)

Now in order to get a good download of these don’t open the Excel files up in the browser in SkyDrive, simply check the box next to the file and chose the download option on the right-hand side of the screen.  I would do them separately.  Then simply open them up and have at it.  Now if you want to use Power View in Excel you will need to download and install the Office 2013 Preview.  If you want to build out map reports with that you will need to make sure you have an Internet connection so that it can connect to the Bing Map service.

I would be very interested in some feedback and seeing what people build out with the PGHT dataset.  So feel free to leave a comment here or send me a tweet (@denglishbi).

Just an FYI, the Power View book is available on McGraw-Hill Professional, Amazon, Barnes & Noble, Google Books, as well as Kindle, Nook, and other eBook formats and sites.  Please check it out and leave us your feedback and comments:)

Enjoy!

Posted in PowerPivot, Reporting Services | Tagged: , , , | 2 Comments »

SQL Saturday Event Analysis using Power View and Office 2013

Posted by denglishbi on August 6, 2012

[tweetmeme source=”denglishbi” only_single=”false”]

Updated (8/7/2012): Added screenshot at end of post of which includes data broken out by fiscal calendar (starts in July) and link to that file as well.

Updated (8/9/2012): Added some information at the bottom of the post in regards to downloading issues and more information available in the comments section.

Last week I saw a post by Sam Vanga called SQL Saturday US Map.  Needless to say I found it interesting and a great idea.  That made me think a bit and I was like hmm… why not take that same data and use it with the new Excel 2013 with PowerPivot, Power View, and maybe even a little Office 365!  I had to leverage the Microsoft stack of course:)

So I went out to the SQL Saturday site and copied down all of the event details. Needless to say a little scrubbing was required because the data was a bit incomplete to get at some of the location information.  After a little while I felt fairly good with the data and loaded the information into PowerPivot for Excel 2013.  I added a few more columns around the date information to generate a calendar and to do some sorting.  Once that was done I went ahead and started to put together a little dashboard page.  I ended up with the following:

image

We can see that the SQL Saturday events over the past couple of years have really grown in popularity and after 2010 they went global as well.

image

We can zoom in on the map and get a close up as well.  Last year we had the SQL Saturday #99 in Eden Prairie, MN.

image

I even added the ability to drill down from the cities to the zip code level and also some drill down on the column chart for the counts as well.

image

image

Some pretty cool stuff.

We can even upload this into the Office 365 preview and share this information as well which support PowerPivot and Power View.

image

You might notice that the colors for the themes don’t match up quite yet, but other than that it works out well and you can interact with the Power View visualizations and reports!  In the above screenshot in Office 365 I have the tile where the map resides filtered to 2012.  You can see that the map really opens up now for the entire globe compared to the 2010 and 2011 views.  I can only assume that next year it will grow even more:)

The data that I grabbed for this was from the SQL Saturday events page here (just copy paste and a bit of cleanup).

If you would like to download the Excel 2013 file I created you can grab it from here – SQLData.xlsx

Fiscal Year Layout

I received a request from Karla Landrum the PASS Community Evangelist to see the data setup using the PASS fiscal calendar which starts in July versus the regular calendar.  Well I decided to add in a full date table and refresh the output.  Here is the result and the new file can be downloaded here – SQLDataFiscal.xlsx

image

If you are experiencing any issues with the downloads take a look at the comments section of this post.  I did some testing and found some issues if you try to directly download the file from the browser and a workaround if the SQLSat Dash does not load for you.  You can download the file(s) from my Public|Blog SkyDrive folder.

Enjoy!

Posted in PowerPivot, Reporting Services | Tagged: , , , | 15 Comments »

Power View meet Microsoft Excel 2013 Part 2

Posted by denglishbi on July 25, 2012

[tweetmeme source=”denglishbi” only_single=”false”]

Last week I did my initial post of going over using Power View inside of Excel 2013 – Power View meet Microsoft Excel 2013.  In that post I went over how I converted the PowerPivot model of the Pan-Geo Hospitality & Travel that was used in our Visualizing Data with Microsoft Power View book (well at least a Tabular SSAS version was used, I recreated the entire model in PowerPivot).  I upgraded that model to use the Excel 2013 version of PowerPivot and then showcased some of the new features such as:

  • Background Images
  • Pictures
  • Themes
  • Relationships
  • Pie Charts
  • Map Visualizations (Bing Maps)
  • Key Performance Indicators

So what other key features are that that might be of interest?  Hmmm, good question.  And yes, there are more features.  Have you been wanting support for hierarchies?  What about drill up and down capabilities?  Well guess what, you get them both:)

You might have noticed in the previous post that you saw some hierarchies listed in the field list:

image

Let’s take a quick look at using the Country Hierarchy and see how this looks in a table, matrix, and a chart.

Table

image

Matrix

image

Chart

image

So in the table and matrix no change other than the fact that we can see our hierarchies in the field list and select them.  This allows us to quickly add multiple fields to the canvas.  What about the chart though?  I picked the country hierarchy, but I am only seeing the first level of the hierarchy which are the continents.  Where are the countries?

Well if you double click on the columns in the chart it will actually drill down into that continent and display the data for the countries!

image

You will also see that the sort by and title text changed to display country and there is a new icon available when you hover over the chart, an arrow that provides drill up functionality.  So the drill up will bring you back up to continent. 

Now the neat thing about the drill up and down functionality is that you can expand on this.  The fields do not necessarily need to be part of a hierarchy, you can actually build out the drill up and down capabilities by adding fields into the field well.  So in this example I will add more fields into the chart below the country:

image

So let’s double click a few times to see what we get:

image

image

Now the one thing is that we really are not sure what we are looking at, meaning that what continent, country, and chain type did we select previously?  I can see based on the sort the trail that I have navigated, but what were the values associated with them.  That would be a nice feature.

The drill down also works for the map reports as well.

image

So if we double click on the China pie chart we will go down to the city level based on the navigation defined in the field well:

image

And you can use the zooming capabilities of the map as well.

image

Pretty cool and you can do more with the map with the layout settings in the Ribbon:

image

In addition to hierarchy, drill up & down, and cool map capabilities there is another minor addition that was added and that was support for hyperlinks in a text box.

image

In this example I have a text box that includes the words ‘Microsoft BI’ and below that a hyperlink to the web site.  If I hold the CTRL key and click on the hyperlink it goes to the web site:

image

They hyperlink simply gets added after you type in the URL and press a space, hit enter, or click out of the text box.

Well that covers the majority of the new enhancements to Power View, for the complete list checkout the links at the bottom of my previous posting – Power View meet Microsoft Excel 2013.

I will continue to work with the new features and post any additional findings I might come across like using images from the data models and the issues you might encounter along with using these files in SharePoint.

Posted in Business Intelligence, Reporting Services | Tagged: , , , | 13 Comments »

Power View meet Microsoft Excel 2013

Posted by denglishbi on July 19, 2012

[tweetmeme source=”denglishbi” only_single=”false”]

This week Microsoft released the Public Review of Office 2013 (aka Office 15).  You can download and check this out now for yourself and read some reviews of the new changes here:

One of the items that I have been patiently waiting to talk about and demonstrate is the new Power View and not only the new enhancements to it, but that it also is available in Excel 2013!  With Excel 2013 the PowerPivot and Power View COM add-ins are provided with the installation, you simply need to enable them in the Options->Add-Ins section.

Before I dive into the new Power View let me show a quick screenshot of one of the Power View reports from our Visualizing Data with Microsoft Power View book.

image

A couple of things I want you to take a look at primarily is the field list.  Also you will be able to compare this look to the enhanced one that I will now show off in Excel 2013.  To create my Excel 2013 I decided I would go against a complete Excel solution, so I created a complete Pan-Geo Hospitality & Travel PowerPivot Model.  I did this first in Excel 2010 and then upgraded this in Excel 2013 by accessing the Model in the PowerPivot Ribbon in Excel 2013 (you will notice that in this screenshot you will see two PowerPivot tabs and that is because I have both versions of Office running along with the add-ins (PowerPivot for Excel from SQL 2012 and now the one for Microsoft Office PowerPivot for Excel 2013).

image

When I opened up my Excel 2010 file with the PowerPivot model in Excel 2013 (which I also enabled the PowerPivot add-in) I then went to the 2nd PowerPivot tab in the Ribbon and clicked the Manage button in the Data Model section.

image

Could really use a line break in this warning message box:)

image

So just to reiterate the situation and give you an option to cancel.

image

Time to reboot:)

WARNING: I did notice one issue with the upgrade, the KPI that I had defined in my Excel 2010 PowerPivot model did not convert over, so I had to create the measure from scratch and setup the KPI again

Once I had the model converted over I used the new option in the Insert tab of the Ribbon for Power View (right in the middle in the Reports section)!

image

If you click on this and you do not have the add-in enabled you will be prompted and you can enable it then.

image

This creates a new worksheet in the workbook and then you can start building out your report, just like you can do with the current version of Power View, but this time you are doing it in Excel and not in your web browser as part of the Reporting Services 2012 integration with SharePoint 2010.

Here is what I ended up with recreating the Hotel Performance Dashboard report displayed above (notice if you can see a few extra items I have added and any other differences):

image

Did you see anything new on the report?  No, not the fact that I changed the Play Axis in the scatter chart or the data labels being added in the bar chart.  Look closer….okay, so you did see it, there are images included in the report and they are not part of the model definition!

The first one that I will point out is in the top left hand portion of the report and the new option I used here is the Picture option in the Insert section.

image

You can include Image files now so you can include the company logo as a report header (jpg, jpeg, and png files).

The other image you see is in the background of the report and for this I used the Set Image option in the Background Image section.

image

Here you can select the same type of image files as the picture and then you can specify the position option as Fit, Stretch, Tile, or Center. Along with that you can specify the transparency level and here I have it set to 90%.

Pretty neat, right?

Well you can do more formatting.  If you recall in the existing Power View we have Styles – Using Styles in Microsoft Power View.  In the new version here we can really tweak the report setup using the Themes section.

image

I can change the Font from Segoe UI to Times New Roman. I can select a different Theme, adjust the Font Size, and alter the Background (these changes are all at the report level, not item).  The result (not saying this is ideal) ends up looking like the following:

image

Another interesting item you can do here in Power View is in the Data section of the Ribbon.  You can actually review and modify relationships.

image

Pretty slick.

Let’s quick go back to the second screenshot above and take a look at the Field List.  Notice something different here?  What are those Globes and Spotlights doing in the list?  Yep, you guessed it, Power View now provides geo-coding capabilities to use with the new Map visualization, plus it also supports Key Performance Indicators (KPIs)!  In addition to the new Map visualization, the Pie chart has also been made available.

image

You can even include Pie charts in Maps (just a bit of a warning here, currently the Pie charts do not support data labels, similar to PerformancePoint Analytical Chart reports).

The mapping capability uses Bing Maps just like SSRS does for some of its mapping that was introduced in SQL Server 2008 R2.

image

Here is an example of a Map (including Pie charts, just to put it over the top):

image

You can see in the Field Well that there are new spots for Locations, Longitude, and Latitude.

If you are looking for the Card visualization it is now under the Table.

image

Now what about those KPIs, how do those look?

image

Well, looks like we still need some work here, but it is a start.  The indicators it is using are not correct.  I would like to see a more condensed view and options here to provide the detail information about the KPIs, but at least we can include them now.

Now there are more new items and capabilities that I haven’t even touched on yet, so stay tune for another post next week.

For more information about the new BI features in Office 2013 check out the following links:

Enjoy and kudos to all of the Microsoft teams that were involved to make all of this happen!

If you liked this post, check out the 2nd part here – Power View Meet Microsoft Excel 2013 Part 2

Posted in Business Intelligence, Reporting Services | Tagged: , , , | 13 Comments »