Dan English's BI Blog

Welcome to my random thoughts in regards to Business Intelligence, databases, and other technologies

Archive for May, 2017

PASS Business Analytics Marathon–June 7

Posted by denglishbi on May 22, 2017

The next PASS Business Analytics (BA) Marathon is coming up next month on June 7 and there is a great list of topics and speakers lined up. Register now and get the sessions on your calendars in preparation for the big event.

image

Register here – http://bit.ly/passbasummer2017

  • Analyzing Real-Time Data Using Azure Streaming Analytics

    • 07 Jun 2017 17:00 GMT – Michael Johnson

      In today’s fast-paced world, businesses require up to the minute information to support critical decisions. Traditional business intelligence solutions, however, are not able to keep up with this demand and a new approach is required. Azure Stream Analytics is a real-time event processing engine capable of analyzing millions of events every second. During this session, you will learn some of the key concepts needed to work with streaming data before stepping through an end-to-end streaming data solution.


  • Replacing Brio: Practical Advice for Analysts

    • 07 Jun 2017 18:00 GMT – Julie Hyman
    • Brio, or Hyperion Interactive Reporting, was a staple of reporting for a long time. Following Oracle’s announcement to terminate premium support in April 2015, Brio users have been working without a safety net.

      During this session Quest product manager, Julie Hyman will examine the crossroads at which many organizations find themselves as they replace Brio. She will explain the environment, common use cases and must-haves for a self-service data preparation tool for reporting. Julie will go on to share how to safely move from Brio to a more modern self-service data preparation solution to:

      • Overcome challenges such as data-source proliferation, spreadsheet sprawl, manual processes and more.

      • Understand the top three workflows any reporting solution must handle efficiently.

      • Compare criteria for a replacement tool, such as integrating/preparing data, building queries and workflows, managing workloads and more.

      Julie will give you expert advice so you can move forward confidently while reducing risks.


  • From Hours to Milliseconds: Using GPUs to Accelerate Data Discovery and Visual Analytics

    • 07 Jun 2017 19:00 GMT – Todd Mostack
    • Technology advancements have created an explosion of human data — millions of tweets, hours of video, and patterns every day. However, analyzing and acting on this data in a timely manner is still prohibitive – until now. Born out of video game technology, GPUs are now being used to rapidly accelerate query times from hours to milliseconds for companies small and large. Todd will discuss how GPUs are disrupting the way we do data-driven business with lightning fast analytics and how business leaders can harness the tools available to them to explore and visualize data in real-time.


  • A Lazy Data Scientist’s Toolkit

    • 07 Jun 2017 20:00 GMT – Mark Wilcock
    • The client has some burning business questions and you have the client’s data. So which tools will help you to understand that data quickly and tell your client something they did not know already? In this session, Mark will take you through his personal choices, demo each of them, explain their value and show how quickly and easily the client can start making decisions with their data. The tools are

      • Tableau, a data visualisation tool, for exploring and presenting data beautifully,

      • R and packages for data manipulation, plotting, text mining and predictive analytics,

      • Excel – for pixel perfect reports,

      • Power BI, an analytics and visualisation tool, for doing just that!,

      • A SQL database in the cloud for improving data quality,

      • A cloud-based machine learning toolkit (Azure ML),

      • And cognitive services APIs for text analysis (and how to call them easily from R).

      We’ll use a wide variety of public datasets in our examples. These include:

      • The recent results of the strength of EU banks from the European Banking Authority,

      • Health, wealth and populations stats from the Gapminder foundation,

      • Lifespan data from the Lancet and the corporate responsibility reports from a large bank.

      The examples will also use some fictional data, but based on a real project, about a trading firm’s revenue reporting and other activities.

Register here – http://bit.ly/passbasummer2017

Posted in Training | Tagged: , , | Leave a Comment »

SQL Server 2017 CTP2.1 Install Experience

Posted by denglishbi on May 18, 2017

In this post I will walk through the install process highlighting the changes of the SQL Server 2017 install. This will be using the CTP2.1 release (May 2017) of the installer and I will also be using the new Power BI Report Server install which is a new light weight installer that is not part of the core server product installation.

I will just include some of the key screenshots from the installation and highlight some of the differences.

Install SQL Server 2017 CTP2.1

image

image

image

We can see here that Reporting Services has now been removed from the core installation similar to SQL Server Management Studio and SQL Server Data Tools. This is now a more light weight installation and it needs to be downloaded separately, just like Power BI Report Server.

image

So we see that now for Machine Learning there is also Python support and that SSIS has new scale out capabilities. In addition to this Reporting Services – Native installation has been removed (and no more SharePoint integration!).

image

New Consent to Install Python, similar to the experience we have seen with Microsoft R Open.

image

image

Everything successfully installed that we selected!

Install SQL Server Management Studio 17.0

image

image

image

The new SSMS 17.0 splash screen.

image

Build Version for SQL 2017 CTP2.1 – 14.0.600.250

Installing Power BI Report Server

This is available for customers that purchase Power BI Premium or have SQL Server Enterprise Edition with Software Assurance.

image

image

image

image

image

image

Once you have completed the install then you will need to use the Report Service Configuration Manager to connect and complete the setup tasks – creating database, establishing the web service and web portal URL, etc.

image

What we see here is that it has created a named instance for the Power BI Report Server called ‘PBIRS’.

In reviewing the new tables that are part of this installation I noticed three new tables: CleanupLock, Comments, and ProductInfoHistory. The first two tables are blank for now, but the ProductInfoHistory did have one record in it stating the build number for the current SKU installed.

image

I just noticed one other item, it appears in the configuration table you can control if users have the ability to export Power BI report data and this can also be accessed if you connect with SQL Server Management Studio and review the Advanced settings. The ability to control the Custom Visuals is also an option.

image

image

image

Successful configuration and you can see we have a similar color scheme like the Power BI Service for the default and using the new Power BI logo, very nice.

So the new Power BI Report Server is a superset of Report Server where it contain mobile reports, KPIs, paginated reports, and now Power BI reports. Plus you can upload Excel workbooks and we expect them to be viewable in the browser in the near future like Power BI reports.

Now to make Power BI reports that are supported in Power BI Report Server you need to use the Power BI Desktop (Report Server) version of the application, which is a separate install as well and can be installed side-by-side with an existing version of the Power BI Desktop applications.

The May 2017 release of Power BI Report Server will now support Power BI Custom Visuals, so that is really cool!

Install Power BI Desktop (Report Server)

image

image

image

image

image

image

image

From the start screen here you will see a new option to ‘Open from report server’ and some Reporting Services links to the forums, blog, and tutorials.

image

image

I can open up an existing report and then deploy this to the Power BI Report Server. Just remember that currently only Live SSAS connections are supported as a data source, no other data sources are supported for the time being, hopefully later this year we will see additional support so that we can use embedded models.

image

To publish to the Power BI Report Server simply select File—>Save as—>Power BI Report Server

image

Enter the Web Portal URL

image

Pick the location if you want to place it in an existing folder possibly and then click OK.

image

Then you can click on the ‘Take me there’ link and you will be able to view your report.

image

From here you can interact with the report, print it, different options for viewing the report (fit to width, fit to page, and actual size), open it back up in Power BI Desktop, explore the data, refresh the report, filter the data, add comments to the report (comments also support ability to add attachments as well).

Now if you are not able to install Power BI Report Server (and remember, if you can use this, you will still need additional Power BI Pro licenses for the report authors and users that want to export the reports to say PowerPoint or CSV, sorry no Excel option yet…) you can install the regular Reporting Services.

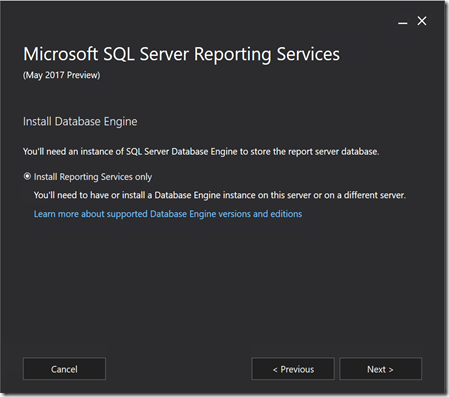
Install Reporting Services

Nothing too different from the Power BI Report Server installation.

image

image

image

image

image

image

image

This time the named instance that tool creates is called ‘SSRS’.

After the install you can go into the Reporting Services Configuration Manager and complete the configuration, just like in versions past.

So that is it for now, hope you enjoyed the quick walkthrough experience of the new SQL Server 2017 installation!

Posted in Power BI, Reporting Services, SQL Server | Tagged: , , | 1 Comment »

On-Premises Power BI VOL. 2

Posted by denglishbi on May 5, 2017

Here we go again, round 2 (or should I say Vol. 2). I am back to discuss how I feel (and I am sure quite a few others do as well) about the new information we received this week on Microsoft Power BI on-premises. You can check out my first blog post regarding this here – On-Premises Power BI–A Microsoft Story.

All of the opinions and information that I state in this post here is simply my personal experiences as well as a few thoughts that I just wanted to post. Oh and by the way, I am not a graphic artist by any means, so please don’t slam me for my mocked up image below. I love movies, so just wanted to put this quick little graphic together, I hope you like it.

image

What we have learned this week is that Microsoft will provide customers two options to get the on-premises Power BI functionality that will be part of what has now been called Power BI Report Server (this is actually a superset of Report Server – so includes all Report Server functionality plus Power BI). Option 1 is for organizations to go with the new Power BI Premium option. So basically along with the Power BI Service cloud functionality, Microsoft is providing customers the on-premises Power BI Report Server which will include a SQL Server Technology License that you can use to install Power BI Report Server, database engine, and Analysis Services (SSAS) on a single server. The SSAS will provide users the ability to create the data models for the live SSAS connections that Power BI on-premises will initially support. Basically this option will cost an organization roughly $5k/month at minimum based on the calculator (so we are talking at least $60k/year).

Option 2 then is for customers that purchase SQL Server Enterprise Edition (EE) along with Software Assurance (SA). If you have this then you will be entitled to Power BI Report Server, but there is a catch, read all of the fine print in the post (particularly the bold text).

Power BI Report Server is an on-premises server that enables Power BI Pro users to publish Power BI reports and distribute them broadly across the enterprise, without requiring report consumers to be licensed individually per user.

So what this means is that even though you just invested $XXX,XXX six figures or possibly more for your SQL Server EE + SA you will also need to pay a $10/month subscription fee for each Power BI Desktop report author that wants to publish reports to the Power BI Report Server. But wait, there is more! If consumers of the report want to export reports to say PowerPoint or Excel (and come on, how many users don’t want to export reports…), they will also need Power BI Pro licenses.  Granted the text might not call that out specifically, but that is what is also meant by “distribute”.  What most users will see is just the following in the post:

without requiring report consumers to be licensed individually per user

So that statement is not necessarily true from what I have been told, if a user wants to export a report, that will cost each user $10/month subscription because they will require a Power BI Pro license.

Now I don’t believe technically Microsoft will be able to enforce and track the Power BI Pro license for on-premises to enable / disable features such as publishing and export, but if you were ever audited then that could come back to bite you if you didn’t purchase them and are using this functionality.

How do I feel about this…. I am not happy by any means. I don’t understand this at all to try and nickel and dime customers of SQL EE + SA that want to leverage the Power BI on-premises. First Power BI wasn’t made available to SQL 2016 customers and has been pushed (or at least we thought) into SQL 2017 (formerly known as vNext). Now we are finding out that the Technical Previews of Reporting Services we have been using with Power BI functionality is not going to be made available to SQL 2017 customers unless you purchase EE + SA. But even if you do purchase that you also have to buy Power BI Pro subscriptions!!!

Hmmm…. I am trying to draw a comparison here of how I see this being played out.

image

Do you see where I am going with this? Can you draw any similarities here? T-Mobile vs Sprint?

So for my company we already have on-premises Power BI and we have been using this now for almost a year. This is because we own BI Office (Pyramid Analytics). For BI Office on-premises Power BI is provided and supported and there are no hidden fees, taxes, charges, costs, etc. associated with the product to get this functionality. All we need to do is pay our yearly maintenance agreement (and that is like 60% less than what we would need to pay for Power BI Premium). And in addition to Power BI on-premises we also get all of the BI Office features like dashboards, R integration, and much more! I can actually incorporate BI Office reports, SSRS reports, Power BI reports, and more all on a single dashboard page and they can all interact with each other!!! How cool is that? Kind of reminds me of PerformancePoint, but this actually works and is much easier to configure!

I am truly disappointed in the decision that has been made here for Microsoft customers. We have been working on our new BI roadmap for the Power BI the past two years, had a delay in the Power BI on-premises release, and now we need to possibly payout even more money. That is confusing and frustrating for customers (and champions / advocates of Microsoft BI like myself) and is definitely going to bite Microsoft. Enough with the games Microsoft, have we not been patient enough? I am sorry to say that now we are most likely not going down this path and I am extremely upset about this because I have been wanting and pushing for this capability. So for us we are going back to the BI roadmap and looking at Plan B and focusing our attention on the un-carrier.

Posted in Power BI, Reporting Services | Tagged: , , | 21 Comments »