Dan English's BI Blog

Welcome to my random thoughts in regards to Business Intelligence, databases, and other technologies

Archive for the ‘Data Explorer’ Category

Power BI using Service Principal with Synapse Data Explorer (Kusto) Pool

Posted by denglishbi on September 21, 2022

In my last post I went over using a Service Principal account to access a Synapse SQL Pool with Power BI. I even showed how you could go across different tenants in my example. In this post instead of going against a SQL Server source I am going to switch to a Synapse Data Explorer (Kusto) Pool. Once again we will use the SQL Server ODBC driver just like we did in my last post.

For this post I will be using the same Service Principal and driver that we used in the previous post, so if you need any guidance with that or link to download the driver please reference that post here.

For the example that I will present here I will be do the following:

  • Create a Synapse Data Explorer Pool and load data
  • Grant the Service Principal account permissions to the Synapse Data Explorer Pool database (NOAA Storm Events data)
  • Configure the ODBC System DSN to access the Synapse Data Explorer Pool
  • Create a dataset and report using the ODBC source connection in Power BI
  • Publish the report in a different tenant than the Synapse Workspace
  • Configure a gateway to use in the Power BI service with the dataset
  • Refresh the Power BI dataset and view the report in the service

As mentioned I will be reusing some of the items that were covered in the previous post, the only difference is that we will be going against a Synapse Data Explorer (Kusto) Pool. If you are already familiar with Azure Data Explorer (ADX) you can review the document here to see how these compare.

First step will be to create the Synapse Data Explorer Pool within the same Synapse Workspace we used in the previous post with the Synapse Dedicated Pool. This can be done in a few different places within the Azure Portal (Synapse Workspace Overview page or Analytics pools section) or in the Synapse Studio (Data or Manage Hub). In this example I am doing it in the Azure Portal and simply click the New Data Explorer Pool option in the Synapse Workspace Overview page and complete the required information.

Create Data Explorer Pool configuration screenshot

I didn’t make any other setting changes and simply created the pool, this will take a few minutes to complete (approximately 15 minutes for me). In the meantime I have decided to use the NOAA Storm Events data which is a sample you will explore if you doing any of the Kusto Query tutorials on the Microsoft Learn site. I went ahead and downloaded all of the StormEvents_details files (73 of them) and extracted them to a folder on my laptop (1.31 GB total).

Once the pool is created on the Overview page you will be presented with a wizard that you can complete to create the initial database and load data.
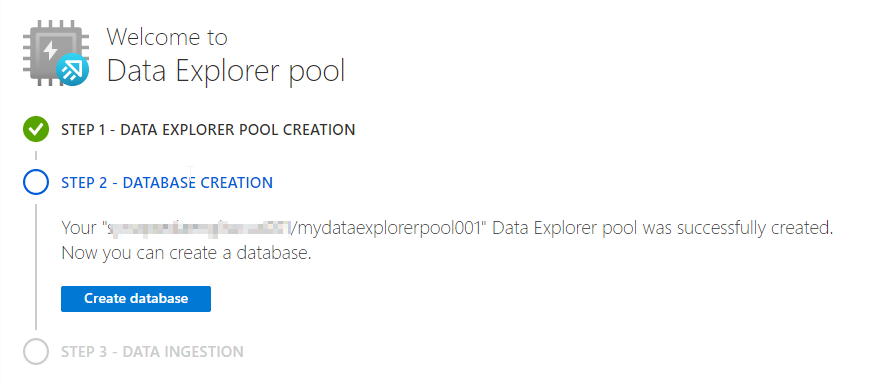
Synapse Data Explorer Pool wizard screenshot

Simply click the Create database button, enter a database name and set the day settings, and then click Create.

Data Explorer Database creation screenshot

Creating the database will not take long and after you click the Refresh button on the Overview page you will be at Step 3 – Data Ingestion. Click on the Ingest new data button which will then launch Azure Data Explorer window with a connection to the newly created database. If we right-click on the database we can select the option to Ingest data which will launch us to another wizard to name the table, provide the source, set the schema, and then ingest (load) the data into the new table.

Azure Data Explorer Database screenshot

Provide a name for the new table on the Destination page and then on the next page in the wizard we will set the source.

Ingest New Data Destination screenshot

For the Source page you can simply drag and drop the 73 storm event csv files and it will start to upload them which will take a few minutes to complete (approximately 8 minutes for me). Next you can go to the Schema page and review what was done based on analyzing the data.

Ingest New Data Source screenshot

Go ahead and review the Schema page to how the data was mapped if you want and then click on the Start ingestion button.

Ingest New Data Schema screenshot

Now the storm events data will be loaded into the table and this will take a few minutes to complete but should go relatively quickly and once this is done you will see a Data preview.

Ingest New Data screenshot

Now we are ready to move on to the second step and grant the Service Principal account access to the database. This can be done at the cluster level or database. In the Azure Portal within the Data Explorer Pool Permissions page you can add the Service Principal to the AllDatabasesViewer role.

Data Explorer Pool Permissions screenshot

Or in Azure Data Explorer in the Query tab with the connection to the new database you can use the following syntax –> .add database <databaseName> users (‘aadapp=<application id>;<tenant id>’) ‘<app name>’ as shown below

The third step is to create the ODBC System DSN which is pretty similar to how we did it for the Synapse Dedicated SQL Pool, but there is a slight twist which took me awhile to figure out and had to go into the registry to make a modification to the ODBC entry🤓

Just like we did in the previous post we will go into the ODBC Data Source Administrator (64-bit), click on the System DSN tab, and click Add. As before use the same ODBC Driver XX for SQL Server, click Finish, enter a name for the DSN, and then provide the Data Explorer Pool connection information which in this case will be in the format of <pool name>.<workspace name>.kusto.azuresynapse.net and you can get this from the Overview page of the Data Explorer Pool in the Azure Portal. It is the URI information and simply remove the “https://&#8221; information.

First page of the System DSN configuration screenshot

On the next page just like before we will select the option for Azure Service Principal authentication, provide the application id for the Login ID, and then click Next. There is no need to put the Secret Value yet for the Password because we need to simply create the entry first in the registry to modify it and then we can come back in with the password to do an official test.
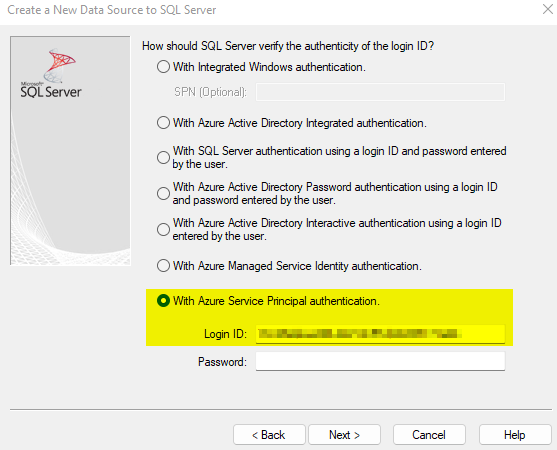
Second page of the System DSN configuration screenshot

On the next page you can go ahead and set the default database setting and then click Next.

Third page of the System DSN configuration screenshot

On the next page you can click Finish and then OK. Now if you would have provided the Secret Value and then tried to test the data source connection you would have been provided this message about “No tenant identifying information found in either the request or implied by any provided credentials” as shown below.

Data Source Connection Error screenshot

This is what we are going to fix in the registry and it took me awhile to track down the solution and thanks to this article here on MS-TDS clients and Kusto I determined how to include the tenant information into the “Language” field in the ODBC data source🤠 Once you have created the System DSN you need to use the Registry Editor to add a new String Value to the ODBC entry called “Language” with the “any@AadAuthority:<tenant id>” format as shown in the link above.

Registry Editor ODBC Language screenshot

Now if you switch back to the ODBC Data Source Administrator you can configure the System DSN that was created to include the Secret Value for the Password and then as you click through to the final page you will see the language information included now based on what you entered into the registry.
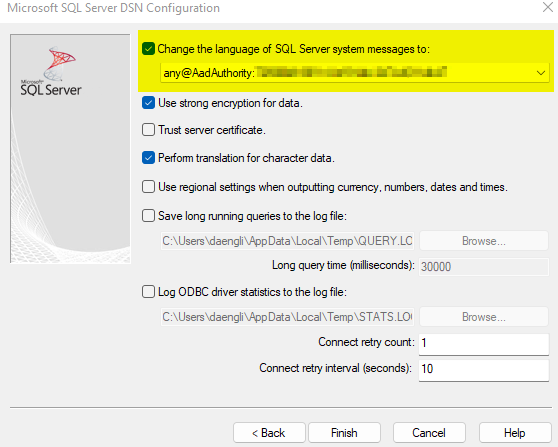
System DSN Configuration Language screenshot

And when you go to Test Data Source now you should see (fingers crossed) a “TESTS COMPLETED SUCCCESSFULLY!” message.

System DSN Test Data Source screenshot

The fourth step now is the easy part, just like we did in the last post, open Power BI Desktop, use the ODBC connection, and connect to our Kusto database to create our dataset.

Power BI Desktop Get Data ODBC screenshot

There is just one table so this is pretty easy. We can clean up the column names to make them more readable, add measures, hide columns that are not needed, etc. and then build out a report. As you can see below in the report we have over 1.7M records loaded and the size of the Power BI file once all of the data is loaded is 188 MB which is much less than the 1.31 GB of CSV files👍

Power BI Storm Events report screenshot

For the fifth step now we simply need to publish the report to the Power BI service which is straight forward and just like the last post and so is the sixth step where we configure the gateway connection once published to include the new DSN data source. Just remember to replicate the ODBC configuration that we did above on the gateway machine that is being used by the Power BI service.

Dataset settings Gateway Connection screenshot

Just make sure to follow the same steps as the last post and reference that if you have any questions.

For the final step you can now go ahead and test everything out by running the dataset refresh and then viewing and interacting with the report.

Dataset Refresh history screenshot

And if we interact with the report everything should be good and just remember once again this demo like the last post is going across tenants using the Service Principal account.

Power BI report screenshot

That completes this post covering the topic of being able to use a Service Principal account to connect to Synapse Data Explorer Pool for a Power BI report.

Let me know what you think and thanks for checking out this post, I hope you found this useful:)

Posted in Azure, Data Explorer, Kusto, Power BI, Synapse | Tagged: , , , , , | Leave a Comment »

IMDb Analysis with Microsoft Power BI

Posted by denglishbi on January 15, 2014

The Microsoft Power BI Contest entry submission ended today and this morning I worked on my video and got my entry posted.  For my entry I ended up going with the Top 250 rated movies on IMDb.  Last year when I was testing out “Data Explorer” (now called Power Query) I did a blog posting that highlighted this set of data along with some Power View reports here – Installing Data Explorer Preview Demo with IMDb Data

Since that post, which was back in March 2013, the data on the web page has changed (ratings of course, but the data available).  Like now the vote counts were not included in the table on the web page.  Also, I was using an external site to get some XML data to reference for additional information about the movies, well that changed to, so I did get to freshen up the demo a bit.  I also had to prepare some additional items for the Office 365, Power BI, Q&A, and I did setup a Windows 8 Power BI demo.

For our entries we were limited to only 10 minutes, so by no means are these going to be an end-to-end instruction guide.  I didn’t go into a deep analysis of the data, what I was trying to demonstrate was the ability to go from a basic web page of data to a fully decked out analysis tool.  I used Excel 2013, Power Query, Power Pivot, Pivot Charts and Tables, Power View, Office 365, Power BI, and the latest Q&A, so I was trying to show off as much as I could and stay within the timeframe provided.  I also had a demo to show off the Windows 8 Power BI app, but I wasn’t sure the Camtasia video capture software would capture the app demo since it was running on my desktop (will need to test that).

Here is the entry on Facebook (view in full screen to get better resolution – also turn the volume up) – IMDb Analysis with Microsoft Power BI.

PowerBI Facebook Demo

Action Item (please help and vote – Jan 20 thru 30)

Starting next week on Monday, January 20 the entries will be open for public voting.  I would appreciate all of the support you could provide (please vote, and pass it on to co-workers, family, relatives, family, etc.).  The voting will run through Thursday, January 30.  Then 10 out of the 61 entries will move on the semi-finals!  So I need all of the support you can provide.  Thanks so much!

Posted in Data Explorer, Power BI, Power Query | Tagged: , , | 2 Comments »

Installing Data Explorer Preview & Demo with IMDB Data

Posted by denglishbi on March 4, 2013

I can’t believe it has been over a year since I posted about Data Explorer in my post Installing Data Explorer Desktop Client.  That was covering the initial release of the client plugin that used the cloud based service from SQL Azure Labs.  Now there has been a considerable amount of work done and there is a public preview of the new COM Add-In you can download and use in Excel. 

Let’s take a look at the requirements:

Systems Requirements

Supported Operating Systems: Windows 8, Windows 7, Windows Vista, Windows Server 2008

  • requires .NET 3.5 SP1 or greater
  • Office 2013 or Office 2010 SP1

You can download the 32 or 65-bit version of this from the Microsoft Office area – Download “Data Explorer”.

image image image


image image image

Here you can see the download loading in Excel 2010.

image 

Here is the add-in being displayed in the ribbon along with the options that are available.

image

Version: 1.0.3207.2 (published 2/25/2013)

image

Now I am going to switch over to Office 2013 because once I get the data loaded into Excel I want to use Power View:)

image

Every time I tried to install the .NET 3.5 framework feature on my Windows 8 machine as well as download and install it from the URL specified I kept receiving the message that it was not able to install and returned the error code 0x800F0906.  I did a little searching and came across this KB article from Microsoft:

Error codes when you try to install the .NET Framework 3.5 in Windows 8 or in Windows Server 2012

I mounted my Windows 8 software and ran the following command to install this feature:

Dism /online /enable-feature /featurename:NetFx3 /All /Source:d:\sources\sxs

(where the ‘:d:’ is the drive letter for the Windows 8 media)

Here are the results of running this to get the framework installed from the command prompt:

image

Once that was finally setup I was able to install the add-in and it was available to load in Excel 2013 (and I am using Office Professional Plus 2013).

image

A little different experience for me with Excel 2013 instead of Excel 2010, I had to go into my COM Add-Ins and enable “Data Explorer”. Where as previously in Excel 2010 it was installed and enabled.

image

Here is the ribbon layout in Excel 2013, same as in Excel 2010.

image

For this example I am going to use the Get External Data->From Web option and tap into some information on the IMDB web site.

image

IMDB Charts: IMDb Top 250 – http://www.imdb.com/chart/top?ref_=nb_mv_3_chttp

Here is what the web page looks like that I am going to extract data from:

image

After I click apply the Query window opens and I can see what is available for me to access, in this case I am interested in Table 0.

image

NOTE: it would have been super cool if the hyperlink URL reference that was on the web site for the movie titles was included in this table, unfortunately it was not, so that forced me to do a little more additional work later on to enrich my data for Power View.

I am going to right-click on the Title column and split the column into two since the year the movie was released is included.

image

To split the column I am going to use a custom delimiter of a space and left parenthesis.

image

Now you can see the new column that was created and I have two columns, Title.1 and Title.2

image

Now I am going to cleanup the Title.2 column and replace the right parenthesis.

image

I will replace the right parenthesis with nothing and apply that change.

image

Now you can see the Title.2 column is cleaned up.

image

I am going to quick browse the values just to verify this and wouldn’t you know, I found one more item that needs to be evaluated.

image

I filtered for just the records with the 2011/I values and one record is displayed for “The Artist”.

image

I take a quick look at that move on IMDB and I see that after the title there is that additional (I), so that must be causing the issue.

image

So I will add another replace condition on the Title.2 column to cleanup that record and replace /I with nothing.

image

The next thing I need to do is take a look at the Steps pane on the right-hand side and you can see the trail of steps that I have performed so far.  You can review them and in this case I am going to go back to the FilteredRows step and delete that step to remove the filter.

image

I get a warning about deleting a step in my process letting me know that it could impact subsequent steps, but I am okay with that.

image

Now we have my final dataset that I want to work with and this gets added into a new worksheet in Excel once I click Done in the Query window.

image

Now with a little of additional work with help from some calls out to the Internet and VBA we can get some additional information about these movies and make a Power View report like this (I made some additional adjustments to the model in PowerPivot as well, but this is more about Data Explorer, so we will skip that side of things):

image

The Rated ‘R’ movies have the most votes and you can see they have the top ranked moves as well by looking at the card layout.

By clicking on PG-13 in the bar chart in the middle we can filter the entire report – cards, summary data at top of report, as well as the column chart.

image

Based on the top 250 ranked movies from IMDB we can see that the average PG-13 movie has a rating of 8.2 and “The Dark Knight” has the highest rating of 8.9 with over 900 thousand votes.

I tracked down one of my favorite movies, “The Matrix”, and it was ranked 19 with an overall 8.7 rating.

image

We can also see down below that starting in the 60’s, the ‘R’ rated movies started to gain some traction and as the years go on those are the more favored movies, quite the difference compared with earlier decades where it was dominated by the ‘Approved’ rating, but maybe ‘R’ was not even a classification back then.  More than likely if we had some demographic information on the voters we would probably see some correlation with that as well.

image

That is it for now, a quick preview of the install process as well as tapping into some data from a web URL, which in this example was IMDB.

You can check out some Getting Started, Tutorials, and How-to information here – Data Explorer Help.

Posted in Data Explorer | Tagged: , , | 5 Comments »

Installing Data Explorer Desktop Client

Posted by denglishbi on December 19, 2011

[tweetmeme source=”denglishbi” only_single=”false”]

In this post I will go over the installation of the new “Data Explorer” client tool that is available to download as an Office plugin providing you the ability to launch the tool from within Excel.  Data Explorer is a new tool available in the SQL Azure Labs in the cloud that allows you to do some self-service ETL capabilities.  You can pull in your data from Excel, flat files, databases, the web, data feeds, etc. and then mash the data up as well.  Along with this Microsoft will also provide you additional data recommendations form the Azure Data Marketplace that might be of interest to integrate with your data and then you can publish the new set of data.  Once the new data is published you can consume it back into Excel using the Excel plugin and also make it available to others to consume as well.

So let’s take a look at the requirements for this new Excel plugin:

System requirements

Supported Operating Systems: Windows 7, Windows Vista

  • .NET 3.5 SP1
  • Office 2010 SP1 or Office 2007

You can download the tool (32-bit or 64-bit) from the Microsoft Download Center here – SQL Azure Labs Codename “Data Explorer” Client (Labs Release)

Here is a quick walkthrough of the install process

imageimageimage

imageimageimage

image

Once you have this installed you will see that this adds a new add-in to Excel called ‘Data Explorer Excel Add-In’:

image

And this will add a new section in the ‘Data’ tab of the Excel Ribbon called ‘Data Explorer’ with two buttons, one opens the Data Explorer tool to create workspaces and work with data, and the other one allows you to connect so that you can consume data into Excel.

image

The current version of the Data Explorer client is:

Version: 1.0.2755.2 (Release)

For more information check out the following sites:

Check out some of the postings by fellow SQL Server MVPs Jamie Thomson and Chris Webb as well:

Posted in Data Explorer | Tagged: , , | Leave a Comment »