Dan English's BI Blog

Welcome to my random thoughts in regards to Business Intelligence, databases, and other technologies

Posts Tagged ‘sql server’

SQL Server 2017 CTP2.1 Install Experience

Posted by denglishbi on May 18, 2017

In this post I will walk through the install process highlighting the changes of the SQL Server 2017 install. This will be using the CTP2.1 release (May 2017) of the installer and I will also be using the new Power BI Report Server install which is a new light weight installer that is not part of the core server product installation.

I will just include some of the key screenshots from the installation and highlight some of the differences.

Install SQL Server 2017 CTP2.1

image

image

image

We can see here that Reporting Services has now been removed from the core installation similar to SQL Server Management Studio and SQL Server Data Tools. This is now a more light weight installation and it needs to be downloaded separately, just like Power BI Report Server.

image

So we see that now for Machine Learning there is also Python support and that SSIS has new scale out capabilities. In addition to this Reporting Services – Native installation has been removed (and no more SharePoint integration!).

image

New Consent to Install Python, similar to the experience we have seen with Microsoft R Open.

image

image

Everything successfully installed that we selected!

Install SQL Server Management Studio 17.0

image

image

image

The new SSMS 17.0 splash screen.

image

Build Version for SQL 2017 CTP2.1 – 14.0.600.250

Installing Power BI Report Server

This is available for customers that purchase Power BI Premium or have SQL Server Enterprise Edition with Software Assurance.

image

image

image

image

image

image

Once you have completed the install then you will need to use the Report Service Configuration Manager to connect and complete the setup tasks – creating database, establishing the web service and web portal URL, etc.

image

What we see here is that it has created a named instance for the Power BI Report Server called ‘PBIRS’.

In reviewing the new tables that are part of this installation I noticed three new tables: CleanupLock, Comments, and ProductInfoHistory. The first two tables are blank for now, but the ProductInfoHistory did have one record in it stating the build number for the current SKU installed.

image

I just noticed one other item, it appears in the configuration table you can control if users have the ability to export Power BI report data and this can also be accessed if you connect with SQL Server Management Studio and review the Advanced settings. The ability to control the Custom Visuals is also an option.

image

image

image

Successful configuration and you can see we have a similar color scheme like the Power BI Service for the default and using the new Power BI logo, very nice.

So the new Power BI Report Server is a superset of Report Server where it contain mobile reports, KPIs, paginated reports, and now Power BI reports. Plus you can upload Excel workbooks and we expect them to be viewable in the browser in the near future like Power BI reports.

Now to make Power BI reports that are supported in Power BI Report Server you need to use the Power BI Desktop (Report Server) version of the application, which is a separate install as well and can be installed side-by-side with an existing version of the Power BI Desktop applications.

The May 2017 release of Power BI Report Server will now support Power BI Custom Visuals, so that is really cool!

Install Power BI Desktop (Report Server)

image

image

image

image

image

image

image

From the start screen here you will see a new option to ‘Open from report server’ and some Reporting Services links to the forums, blog, and tutorials.

image

image

I can open up an existing report and then deploy this to the Power BI Report Server. Just remember that currently only Live SSAS connections are supported as a data source, no other data sources are supported for the time being, hopefully later this year we will see additional support so that we can use embedded models.

image

To publish to the Power BI Report Server simply select File—>Save as—>Power BI Report Server

image

Enter the Web Portal URL

image

Pick the location if you want to place it in an existing folder possibly and then click OK.

image

Then you can click on the ‘Take me there’ link and you will be able to view your report.

image

From here you can interact with the report, print it, different options for viewing the report (fit to width, fit to page, and actual size), open it back up in Power BI Desktop, explore the data, refresh the report, filter the data, add comments to the report (comments also support ability to add attachments as well).

Now if you are not able to install Power BI Report Server (and remember, if you can use this, you will still need additional Power BI Pro licenses for the report authors and users that want to export the reports to say PowerPoint or CSV, sorry no Excel option yet…) you can install the regular Reporting Services.

Install Reporting Services

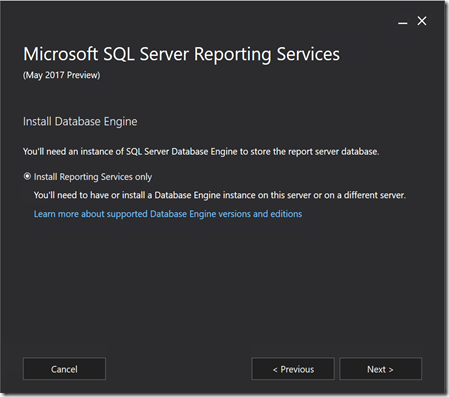
Nothing too different from the Power BI Report Server installation.

image

image

image

image

image

image

image

This time the named instance that tool creates is called ‘SSRS’.

After the install you can go into the Reporting Services Configuration Manager and complete the configuration, just like in versions past.

So that is it for now, hope you enjoyed the quick walkthrough experience of the new SQL Server 2017 installation!

Posted in Power BI, Reporting Services, SQL Server | Tagged: , , | 1 Comment »

On-Premises Power BI VOL. 2

Posted by denglishbi on May 5, 2017

Here we go again, round 2 (or should I say Vol. 2). I am back to discuss how I feel (and I am sure quite a few others do as well) about the new information we received this week on Microsoft Power BI on-premises. You can check out my first blog post regarding this here – On-Premises Power BI–A Microsoft Story.

All of the opinions and information that I state in this post here is simply my personal experiences as well as a few thoughts that I just wanted to post. Oh and by the way, I am not a graphic artist by any means, so please don’t slam me for my mocked up image below. I love movies, so just wanted to put this quick little graphic together, I hope you like it.

image

What we have learned this week is that Microsoft will provide customers two options to get the on-premises Power BI functionality that will be part of what has now been called Power BI Report Server (this is actually a superset of Report Server – so includes all Report Server functionality plus Power BI). Option 1 is for organizations to go with the new Power BI Premium option. So basically along with the Power BI Service cloud functionality, Microsoft is providing customers the on-premises Power BI Report Server which will include a SQL Server Technology License that you can use to install Power BI Report Server, database engine, and Analysis Services (SSAS) on a single server. The SSAS will provide users the ability to create the data models for the live SSAS connections that Power BI on-premises will initially support. Basically this option will cost an organization roughly $5k/month at minimum based on the calculator (so we are talking at least $60k/year).

Option 2 then is for customers that purchase SQL Server Enterprise Edition (EE) along with Software Assurance (SA). If you have this then you will be entitled to Power BI Report Server, but there is a catch, read all of the fine print in the post (particularly the bold text).

Power BI Report Server is an on-premises server that enables Power BI Pro users to publish Power BI reports and distribute them broadly across the enterprise, without requiring report consumers to be licensed individually per user.

So what this means is that even though you just invested $XXX,XXX six figures or possibly more for your SQL Server EE + SA you will also need to pay a $10/month subscription fee for each Power BI Desktop report author that wants to publish reports to the Power BI Report Server. But wait, there is more! If consumers of the report want to export reports to say PowerPoint or Excel (and come on, how many users don’t want to export reports…), they will also need Power BI Pro licenses.  Granted the text might not call that out specifically, but that is what is also meant by “distribute”.  What most users will see is just the following in the post:

without requiring report consumers to be licensed individually per user

So that statement is not necessarily true from what I have been told, if a user wants to export a report, that will cost each user $10/month subscription because they will require a Power BI Pro license.

Now I don’t believe technically Microsoft will be able to enforce and track the Power BI Pro license for on-premises to enable / disable features such as publishing and export, but if you were ever audited then that could come back to bite you if you didn’t purchase them and are using this functionality.

How do I feel about this…. I am not happy by any means. I don’t understand this at all to try and nickel and dime customers of SQL EE + SA that want to leverage the Power BI on-premises. First Power BI wasn’t made available to SQL 2016 customers and has been pushed (or at least we thought) into SQL 2017 (formerly known as vNext). Now we are finding out that the Technical Previews of Reporting Services we have been using with Power BI functionality is not going to be made available to SQL 2017 customers unless you purchase EE + SA. But even if you do purchase that you also have to buy Power BI Pro subscriptions!!!

Hmmm…. I am trying to draw a comparison here of how I see this being played out.

image

Do you see where I am going with this? Can you draw any similarities here? T-Mobile vs Sprint?

So for my company we already have on-premises Power BI and we have been using this now for almost a year. This is because we own BI Office (Pyramid Analytics). For BI Office on-premises Power BI is provided and supported and there are no hidden fees, taxes, charges, costs, etc. associated with the product to get this functionality. All we need to do is pay our yearly maintenance agreement (and that is like 60% less than what we would need to pay for Power BI Premium). And in addition to Power BI on-premises we also get all of the BI Office features like dashboards, R integration, and much more! I can actually incorporate BI Office reports, SSRS reports, Power BI reports, and more all on a single dashboard page and they can all interact with each other!!! How cool is that? Kind of reminds me of PerformancePoint, but this actually works and is much easier to configure!

I am truly disappointed in the decision that has been made here for Microsoft customers. We have been working on our new BI roadmap for the Power BI the past two years, had a delay in the Power BI on-premises release, and now we need to possibly payout even more money. That is confusing and frustrating for customers (and champions / advocates of Microsoft BI like myself) and is definitely going to bite Microsoft. Enough with the games Microsoft, have we not been patient enough? I am sorry to say that now we are most likely not going down this path and I am extremely upset about this because I have been wanting and pushing for this capability. So for us we are going back to the BI roadmap and looking at Plan B and focusing our attention on the un-carrier.

Posted in Power BI, Reporting Services | Tagged: , , | 21 Comments »

Minneapolis Microsoft Data Amp Event–Listening Party Apr 19

Posted by denglishbi on March 30, 2017

Please join me and Paul Timmerman next month Wednesday, April 19 in Edina, MN for the Microsoft Data Amp Live Streaming Event.

MicrosoftDataAmp2

I have reserved a room from 9:30AM to 12PM. The event will start at 10AM.

Seating is limited, so register soon before it fills up.

Register now –> http://bit.ly/mplsdataamp

There should hopefully be some swag available as well to those that attend!

Posted in SQL Server | Tagged: , | Leave a Comment »

On-Premises Power BI–A Microsoft Story

Posted by denglishbi on November 18, 2016

Just a few warnings, backgrounds, and heads up before a do a quick status update here on the current Power BI on-premises situation.  If you do not know me or haven’t met me before, I am a huge Microsoft fan and always have been and will continue to be. I have run every version of the desktop OS since Windows 3.1 as well as Office since version 2.0 and SQL Server since 6.5.  I have owned the three versions of the Zune with the original brick, nano, and touch. I was an early adopter of the Windows phone with the Samsung Blackjack and not until very recently have I made the switch to Android (but I still have a Windows Phone with Win Phone 10 running to test), but that is because of Microsoft’s new vision and direction where their software can run on any device (even on iOS, crazy).  I will always be a fan of Microsoft, nothing will ever change this.

All of the opinions and information that I state in this post here is simply my personal experiences as well as a few thoughts that I just wanted to post. Oh and by the way, I am not a graphic artist by any means, so please don’t slam me for my mocked up image below. I love movies, so just wanted to put this quick little graphic together, I hope you like it.

OnPremisesPowerBI_MicrosoftStory

So let’s begin the story.

Last year, back when Power BI went GA in July 2015 there was a pretty significant announcement made. Microsoft and Pyramid Analytics had formed a strategic alliance and this is what helped Microsoft deliver the Power BI Desktop application so quickly. If you are not familiar with the Pyramid Analytics product offering, BI Office, but you might be familiar with a former product that Microsoft acquired, ProClarity, they are for the most part the same thing. An outstanding tool for doing reports, dashboards, and self-service models with Analysis Services.

Along with the announcement and the release there was information that at some point Power BI Desktop users that owned BI Office would be able to publish their reports to a Pyramid Analytics Server. I was so excited about this announcement that I immediately downloaded, installed, called my Pyramid Analytics sales person, and did a blog post – Power BI Desktop Install Experience & Publish Feature!

Well needless to say it took some time for the Publish feature to be actually turned on and the new version of BI Office to be available, so flash forward to basically one year later from the GA announcement and Pyramid Analytics Launches On-Premises BI for Power BI Desktop. Once again I downloaded the new version of Power BI Desktop and I then had to wait for the new version / update for the BI Office.  Once I had everything installed I was able to quickly test out and use Power BI reports on-premises, very exciting!

Example of a Power BI Desktop report in BI Office:

image

A few things to note about the Power BI and BI Office functionality:

– the reports have to be created with live connections to an Analysis Services database

– custom visualizations are not supported

– Power BI report items and reports can easily be integrated into BI Office dashboards (storyboards)

– the reports can be modified and viewed in the browser, but they cannot be saved, would need to download and publish to update

– Power BI published reports can be secured through BI Office

– Power BI reports can easily have the data sources changed once published in BI Office if migrating content between environments


So this is all good.  Now in the meantime, pretty much everything we are hearing from Microsoft with regards to the roadmap for Reporting Services is that all reports will be able to run in the new SQL Server 2016 Web Portal. This means mobile, paginated, Power BI, as well as even Excel workbooks. This has been talked about and discussed since October 2015. We were a little uncertain about Excel, but with the recent announcements with regards to SharePoint-Integrated Mode going away, we now know that Excel workbooks will be viewable in the Web Portal as well.

The excitement and anticipation for Power BI coming to on-premises in Reporting Services has been building up all year and finally it was demoed at Microsoft Ignite (click link to watch video) and PASS Summit as well as a Technical Preview in Azure being released to test drive. Everyone including me is just biting at the chops to get our hands on this and now it is available. Everything looks great and now the waiting game to see how we can get this new functionality.

Well I was not able to physically attend the PASS Summit this year (I watched some of the keynote and sessions that were streamed live), but apparently it was stated at the What’s New and What’s Next session that Power BI on-premises was not coming to SQL Server 2016 in an update or service pack. This new functionality was in development and would be made available in SQL Server v.Next only.

What?!? Are you serious???? I know, my exact thoughts and I just found this information out YESTERDAY!?!  I was completely baffled, slightly upset, and extremely confused. I followed up on this since I wasn’t able to attend or see the session yet from PASS Summit and it has been confirmed by internal Microsoft resources. The information is apparently public knowledge, no secret, and it has never truly been communicated that Power BI would be coming to SQL Server 2016.  The only thing communicated, but rather slyly, was that Power BI functionality would be coming in the future and was being worked on. But everything we have been seeing has led us to believe that it would be made available in SQL Server 2016, but now sadly that is not the case. I sure hope that customers that purchased SQL Server 2016 in anticipation of this also purchased the product with Software Assurance. Otherwise they could have been misguided by some of the Microsoft sales and messaging.


As of right now, the functionality that we are expecting to see in the Power BI / SSRS on-premises story is very similar to what we (or I should at least say I) have with BI Office.

– the reports have to be created with live connections to an Analysis Services database

– custom visuals are not supported

The main exception though, at least currently, is that there will be no dashboard functionality. That is kind of the secret sauce with BI Office, very slick.


You can continue to stay up-to-date with some of the status with Power BI being made available for on-premises by checking out the Power BI Ideas forums. In the near future we should expect to see a blog posting by the SSRS team to provide us the true communications about the Power BI and SQL Server story, so stay tuned and subscribe to their blog feed.

Well I will wrap this post up. I am not by any means upset with the SQL team, it is complete opposite. I love all of the work they do and amazed at what is being worked on. Just seems like we need better and more accurate communication so that we can keep our expectations in check. This will help the community, MVPs, and customers all plan accordingly and make sure everyone is on the same page.

Posted in Power BI | Tagged: , , | 7 Comments »

PASS Business Analytics VC September Meeting – Building Real-Time Scorecards with Mobile Report Publisher

Posted by denglishbi on September 13, 2016

The next PASS Business Analytics Virtual Chapter meeting has been postponed and will be on Thursday, October 20.  We welcome George Carlisle who will be going over the new SQL Server Mobile Report Publisher that is available in SQL Server 2016.

–> REGISTER NOW <–PASS_BAVC_Logo_New_201502

Oct 20 – Building Real-Time Scorecards with the Mobile Report Publisher

Abstract

Organizations are complex and there is a need to keep things simple. Scorecards can help and now the Mobile Report Publisher formerly the Datazen Publisher can make this data available on desktop and mobile so you can make the best decisions in real time. Information is vital to business today but many organizational leaders wonder how to stay focused on strategic goals with so much operational data at their fingertips? The Scorecard is a strategy performance management tool to help you do this.

Bios –

George Carlisle is building a cloud genetic cloud startup in Maryland. Prior to this, he worked at Ericsson, Verizon Federal, and Hewlett-Packard supporting global accounts in solution architect roles. Also, he is an Adobe, Intel and Microsoft Partner.

image

–> REGISTER NOW <–

If you are planning on attending the PASS Summit 2016 use the following discount code and save $150

Save $150 right now using discount code VC15BKR3

If you are interested in speaking at an upcoming PASS BA Virtual Chapter meeting we are always looking for speakers, please leave a comment or send us an email at PASSBAVC@SQLPASS.ORG

Posted in Training | Tagged: , , , | Leave a Comment »

PASS Business Analytics VC August Meeting – Maximize your Microsoft Investment with BI Office

Posted by denglishbi on August 17, 2016

The next PASS Business Analytics Virtual Chapter meeting is coming up next week on Thursday, August 25.  This month we welcome Pyramid Analytics and they will go over their BI Office product and show the Power BI on-premise solution.  If you are not familiar with Pyramid Analytics, they are one of the PASS national as well as local SQLSaturday sponsors.  If you attend a local SQLSaturday event or go to one of the major PASS Conferences (Summit or Business Analytics) make sure you stop by their location and check them out.

–> REGISTER NOW <–PASS_BAVC_Logo_New_201502

Aug 25 – Maximizing your Microsoft investment with Pyramid Analytics BI Office

Abstract

Pyramid Analytics BI Office is the top analytics platform for the Microsoft BI Platform. BI Office provides a complete on-premise or private cloud solution with unparalleled governance, security, and integration with Microsoft, including Power BI Desktop content. This session will provide an overview discussion and demo of the BI Office application, including advanced analytics with complex topics made easy (such as reusable R models). Target audiences include business analysts, data scientists and Power BI users.image

Bios –

Peter Sprague is VP of Product Marketing at Pyramid Analytics. A veteran of ProClarity, Capstone and Microsoft; Peter Sprague has been developing analytic tools, and designing and deploying enterprise BI solutions for over 15 years.

John Hormaechea is Director of Product Marketing at Pyramid Analytics. John has previously worked at Microsoft as part of the SharePoint and Business Intelligence product marketing teams. and ProClarity in various sales, consulting, and training roles.

image

–> REGISTER NOW <–

If you are planning on attending the PASS Summit 2016 use the following discount code and save $150

Save $150 right now using discount code VC15BKR3

If you are interested in speaking at an upcoming PASS BA Virtual Chapter meeting we are always looking for speakers, please leave a comment or send us an email at PASSBAVC@SQLPASS.ORG

Posted in Training | Tagged: , , , | Leave a Comment »

PASS Business Analytics VC July Meeting – Incorporating R with SQL Server 2016

Posted by denglishbi on July 7, 2016

The next PASS Business Analytics Virtual Chapter meeting is coming up this week on Thursday, July 14.  This month we welcome Microsoft MVP Ginger Grant (b|t) who will talk to us about using R with SQL Server 2016.

–> REGISTER NOW <–PASS_BAVC_Logo_New_201502

July 14 – Incorporating R with SQL Server 2016

Abstract

Interest in the R language is has grown along with the amount of data being accumulated. As Microsoft is now incorporating the R language into SQL Server 2016, the language is going to be a required skill for all data professionals in the near future. This webinar will provide an explanation the different versions of R, demonstrate writing R code in Visual Studio, and run some R code on SQL Server. To ensure everyone who wants to can run this code on their PCs, all of the setup information needed to make R work on SQL Server and the UI will a be covered. After watching this you will know everything you need to start incorporating SQL Server and R.Ginger Grant

Bio –

Having worked with the Microsoft BI stack for many years, Ginger Grant is exploring new challenges by applying her data expertise to the expanding field of data science and data visualization. Using R and Machine Learning she has been able to use data and algorithms to answer many different business questions for users. When not working, Ginger is studying for the pilot degree program Microsoft created for Data Science, blogging at DesertIsleSQL.com and speaking at numerous technical events, including SQL Saturdays, GDI and Women Who Code. An active member of the Microsoft data community, she was recently awarded a Microsoft MVP in Data Platform.

–> REGISTER NOW <–

If you are planning on attending the PASS Summit 2016 use the following discount code and save $150

Save $150 right now using discount code VC15BKR3

If you are interested in speaking at an upcoming PASS BA Virtual Chapter meeting we are always looking for speakers, please leave a comment or send us an email at PASSBAVC@SQLPASS.ORG

Posted in Training | Tagged: , , , | Leave a Comment »

MN PASS Microsoft BI User Group Meeting – Feb 22

Posted by denglishbi on February 9, 2016

The next MN Microsoft BI User Group meeting is coming up in a couple of weeks on Monday, February 22.  We will have two topics, one on the upcoming release of SQL Server 2016 (which CTP 3.3 was just released) and the other on Power BI (all of the new content since I last spoke on it last year – which is a lot of content).

Please Register Now (Please register so that we can have your name badge pre-printed)
image

MN Microsoft BI User Group Feb 2016 Meeting

Sponsored by:

image[12]MSFT_logo_Page

Date: Monday, February 22, 2016

Check In: 12:45 PM Event Time: 1:00 PM – 5:00 PM

Location: Microsoft Technology Center – 3601 76th St W, Suite 600 Edina MN 55435 (in LOW 1, 2, and 3)

Please Register Now (Please register so that we can have your name badge pre-printed)

Agenda:

  • 12:45-1:00 : Check-In
  • 1:00-1:15 : Microsoft BI User Group Updates and Announcements
  • 1:15-2:15 : SQL Server 2016
  • 2:15-2:30 : Break
  • 2:30-3:30 : Getting the new year started with Microsoft Power BI!
  • 3:30-5:00 : Networking and Pizza

Presentations:

Session 1: SQL Server 2016

Microsoft is continuing to invest heavily in BI and Analytics with SQL Server 2016. Reporting Services and Analysis Services are receiving major enhancements and will deliver modern and mobile reporting as well as powerful modeling capabilities. SQL 2016 also brings new advanced analytic capabilities with R Services and enables hybrid BI scenarios to benefit from existing on-premises investments. In this sessions we’ll go over the new BI features of SQL 2016 and talk about the future of BI in SQL Server.

Speaker: Will Weber

Will Weber is a Data Platform Solution Architect with Microsoft. He’s been an active participant in the SQL community in the Twin Cities for a number of years and looks forward to continuing that work in the future. And if the PowerBall gets back up to $1.5 billion he’ll definitely consider buying a ticket.

Session 2: Getting the new year started with Microsoft Power BI!

In this session we will take a look at the changes that Microsoft has released for the Power BI Service, Power BI Desktop, and Power BI Mobile Apps. Microsoft continues to release updates to Power BI on a weekly and monthly basis. Some of the changes since we last met include items such as Custom Visualizations, Full Screen Mode, Pop-Out for Visualizations, Printing, Export Data, QR Codes, Excel Add-In, Widgets, R Visuals Integration, Improved Image Support, and much, much more. Come and check out all of the latest capabilities of Power BI and be amazed!

Speaker: Dan English

Dan is the Senior Data Warehouse Architect at Constellation, Inc. He is also a Microsoft Data Platform MVP, author, technical editor, and community leader. He has been developing with Microsoft technologies for over 15 years, and over 10 years with Data Warehousing and Business Intelligence. He has been working with SQO Server since version 6.5 through 2014 and is exploring 2016. Dan has videos on Vimeo, is an avid blogger, and tweets. Dan is the chapter leader for the PASS Business Analytics VC and on the executive leadership team for the MN Microsoft BI User Group.

Planning on attending the Data Insights Summit or the PASS BA Conference?  If so, make sure to associate yourself with our user group.

Data Insights Summit – Our 3-digit Power BI User Group (PUG) code is 102.

PASS BA Conference – Use the following code to save $100 off registration USMO03

Posted in Training | Tagged: , , , , | Leave a Comment »

Getting Started with SQL Server 2016 CTP3 in Azure

Posted by denglishbi on November 11, 2015

If you have an Azure account (possibly through your MSDN subscription) here is the easiest way to get up and running with SQL Server 2016.

First go to the Azure Portal – http://portal.azure.com

Search and find the SQL Server 2016 CTP3 in the Data and Analytics Marketplace in Azure.

image

Create the Virtual Machine.

image

Start the Virtual Machine once it is created and then once it is running Connect with RDP.

Once it is started up you can search and add items to Start as well as Taskbar such as SQL Server Management Studio, SQL Server Configuration Manager, SQL Server Reporting Services Configuration Manager, etc.

image

Turn off the IE Enhanced Security for Administrators.

image

Download and install the latest version of SSDT for SQL Server – http://msdn.microsoft.com/en-us/library/mt204009.aspx

image

SSDT for Visual Studio 2015 for SQL Server 2016 now includes the database projects as well as the BI project templates, so you no longer need to download and install two separate installs.  If you already have Visual Studio 2015 installed then a smaller download (install) will be used to add in the additional template projects.

image

The installer will download and then install the components. This will take approximately 10 to 15 minutes on the Virtual Machine.

Then add SQL Server Data Tools 2015 to the Start and/or Taskbar for easy access.

image

Review the SQL Server Components installed.

image

Based on this as well as reviewing the summary setup log located here – C:\Program Files\Microsoft SQL Server\130\Setup Bootstrap\Log\ – we can see that the Database Engine was installed along with Data Quality Services, Analysis Services (multidimensional), Reporting Services (Native), Integration Services, Management Tools, and Master Data Services.

We still need to install Analysis Services (Tabular), Advanced Analytics Extensions, and also complete the configuration of Reporting Services.

So to complete the install components we will access the setup in the following location – C:\SQLServer_13.0_Full\.  First we will install the Advanced Analytics Extensions. This is part of the process so that we can use SQL Server R Services.

image

image

Additional steps are required to complete and start using the Advanced Analytics Extensions in SQL Server.

image

Use the link provided in the Warning to access the complete steps to getting R services completed on the server so that you can start utilizing R code with SQL Server.

—————————
Rule Check Result
—————————
Rule "Post-installation steps are required for Advanced Analytics Extensions" generated a warning.

The feature Advanced Analytics Extensions requires some post-installation steps after completing SQL Server setup. Please follow the steps outlined in the link http://go.microsoft.com/fwlink/?LinkId=626645 (Ctrl-C to copy)
—————————
OK  
—————————

This installation for the extensions will also install the SQL Server Launchpad.

Next we will run the installer again and get an Analysis Services Tabular instance installed. For this we will need to install a named instance since multidimensional SSAS was used for the default.

image

image

image

image

Once that is done then run the Reporting Services Configuration Manager to complete the SSRS Native setup.

image

Once connected go to the Web Services URL and click Apply button. Then go to the Database page and use the Change Database option to create a new report server database. Next go to the Report Manager URL and click Apply.

Other items that you might want to do are setup Execution Account, backup Encryption Keys, setup Subscription Settings for file share access, and lastly Power BI Integration!

image

We will setup the Power BI integration so that we can use the new Pin to Power BI capabilities when we create our Reporting Services reports so that we can pin and share content in our Power BI dashboards!

The last item that we have to do is go to Report Manager and we can install the new Report Builder.

image

You will see that Report Builder has a new theme as well as the new Chart Types – Treemap and Sunburst which are great for displaying hierarchical data.

image

There you go, up and running and ready to explore some of the new SQL Server 2016 CTP3 capabilities.

More resources on new features in SQL Server 2016 CTP3:

Cheers!

Posted in SQL Server | Tagged: | 3 Comments »

Tabular Models, Compatibility Level, and Power View

Posted by denglishbi on October 4, 2012

[tweetmeme source=”denglishbi” only_single=”false”]

A couple of weeks ago I did a review of the CTP4 of SP1 that came out for SQL Server 2012 – Installing SQL Server 2012 SP1 CT4 Experience. Part of my test involved upgrading an Excel 2013 PowerPivot file to a Tabular Analysis Service project.  After I did that I setup a BI Semantic Model connection file in SharePoint and explored the Power View designer updates.  It was business as usual and I was seeing all of the new features and functionality that I had previously mention in my posts on Excel 2013 and Power View – Power View meet Microsoft Excel 2013 and Power View meet Microsoft Excel 2013 Part 2.

Well this past week I was prepping for my pre-con for the SQLSaturday #149 event and I noticed something odd.  When I was connecting to my tabular models with Power View I was not seeing my hierarchies or key performance indicators (KPIs).  I was a bit confused.  I upgraded my environment to SP1, so what was going on.  I thought the upgrade provided support for these model features now, right?  I know I had seen them already, maybe I was just imagining things though.  When I was doing my tabular project deployments I was also seeing a new dialog box that I was just clicking ‘Yes’ on without really understanding what it was talking about…

image

I completed out the pre-con still confused and then last weekend I did a bit more digging into this issue.  I went back to my Excel 2013 SQLSaturday model that I upgraded and I reviewed the property settings on the database.

image

The item that I noticed that seemed like it might be important was the Compatibility Level setting.  This database was showing SQL Server 2012 SP1 (1103).  I then took a look at the database I was using for some of my demos.

image

Ahhh, now the light bulb was starting to get bright:) The database that I was deploying was still in the SQL Server 2012 (1100) setting even though I had upgraded my environment to SP1.  Interesting.  Apparently you have the ability to control this setting now if you want to run in different levels or do some testing in the same environment before upgrading all of your databases.

image

I didn’t realize that I now had to make a change on my model property settings before I deployed my database.

Once this setting is changed you will be prompted with the following:

image

Once again I click ‘Yes’ and redeploy to upgrade the database on the server.  Now when I connect to my model with Power View I see my hierarchies and KPIs, perfect!

image

So just something to be aware of now when working with tabular model projects now.  There is a property setting that we have to take a look at, Compatibility Level, and it is a pretty important one for the users of our data models:)

Here are a couple of additional reference links to take a look at (some of this documentation and instructions might differ from what you see with CTP4 of SP1, but they should be available in the RTM of SP1):

Cheers!

Posted in Analysis Services | Tagged: , , | 8 Comments »