This week we had our first in-person PASSM (MN SQL Server) user group meeting. I was holding off on doing my presentation until we met in-person. The presentation I did was the one I did back in November at the Twin Cities M365 Community Days event “Power BI Gotchas – Dan’s Dirty Dozen”. This is a fun one and limiting the items I cover to just twelve is a bit of a challenge, but to keep the talk to an hour it works out well. Here is a link to the slides PASSMN202403_PowerBIGotchasDanEnglish.pdf
The description for the presentation is
“In this session you will get some insights into the Power BI gotchas that I have seen over the years. I will highlight a dozen of what I would call “what not to do” or shall we say “dirty” items. I have had an opportunity over the years to work with some of the largest customers of Power BI in the world and you might be surprised what comes up sometimes;) We will cover items around data model development, DAX, and report design of the things to be aware of and go over how to avoid and fix these things when developing Power BI models and reports that I feel should be avoided. The dozen items that will be covered are just a glimpse into the report development “what not to do” items at least in my opinion, I am sure you have seen your fair share as well and would love to hear what others have come across or potentially done too:)“
I want to thank the Microsoft US Manufacturing organization for sponsoring the event to provide food, dessert, and beverage for the event, that was extemely thoughtful and very much appreciated❤️ I did provide a bunch of random Microsoft and techie stickers as well for the attendees to select from as some swag.
Overall we had at least 20 people in attendance the last I was able to count, which is great. We are still working on growing the in-person events after the pandemic. A really pleasant surprise was Brian Larson showing up with his wife (they are the first two in the third row below on left). That was special, I worked with Brian at Superior Consulting Services and also co-authored the Power View book with him.
I was all decked out in my Microsoft Fabric and Power BI gear. Unfortunately in the quick selfie I took you can’t make out the Power BI shirt or see my yellow Messi Adidas (Power BI inspired).
I did make the Microsoft Fabric trucker hat, turned out okay;)
Next week I will be at the Microsoft Fabric Community Conference, so if you are in Las Vegas as well attending the conference come find me at the Interactive Labs or out and about the event:)
This past Saturday I was able to attend, present, and get connected with the community at the M365 Twin Cities Fall 2023 Community Days event. I haven’t presented at this event since Nov 2011 so it has been a bit and the last time I presented at the event my laptop went into hibernation mode when I was going to do my demo and I couldn’t wake it up, it was an epic fail –> Twin Cities ScarePoint Saturday Follow Up.
This time around I didn’t have any demos, my laptop didn’t go into hibernation mode, and only had a few minor issues with my remote clicker and advancing slides, so I thought it went very well. Now my content wasn’t really any 100 level information for beginners just getting started, but it is stuff that I run into repeatedly with customers, so wanted to share:)
The session was “Power BI Gotchas – Dan’s Dirty Dozen” – In this session you will get some insights into the Power BI gotchas that I have seen over the years. I will highlight a dozen of what I would call “what not to do” or shall we say “dirty” items. I have had an opportunity over the years to work with some of the largest customers of Power BI in the world and you might be surprised what comes up sometimes;) We will cover items around data model development, DAX, and report design of the things to be aware of and go over how to avoid and fix these things when developing Power BI models and reports that I feel should be avoided. The dozen items that will be covered are just a glimpse into the report development “what not to do” items at least in my opinion, I am sure you have seen your fair share as well and would love to hear what others have come across or potentially done too:)
On Friday at the event I went to the speakers dinner and got to meet lots of new people. I know most people in the SQL and BI community, so the M365 group is a little unknown to me. Thanks for all of those that made me feel so welcome and great to meet new people in the community!
In the picture above I am towards the back on the right wearing a blue Microsoft shirt:) I also wore one of my old Microsoft MVP jackets to try and blend in a bit more;)
I got to caught up in the vent and talking with everyone that I forgot to take a selfie picture myself with the attendees of my session. I did get to get included in the speaker photo after the event (I had to stand on my tippy toes in the back row so I could be seen).
Really appreciate the great work the M365 Twin Cities team put into organizing the event and thanks to all of the sponsors, speakers, and volunteers for making this possible. Looking forward to attending and presenting again in the Spring if the team wants me back:)
Here is a link to the pdf version of my slides and I will work on doing a recording of this event to make it available and post a follow up when that is available, that will add more context around the content that I shared – M365TC2023_PowerBIGotchasDanEnglish.
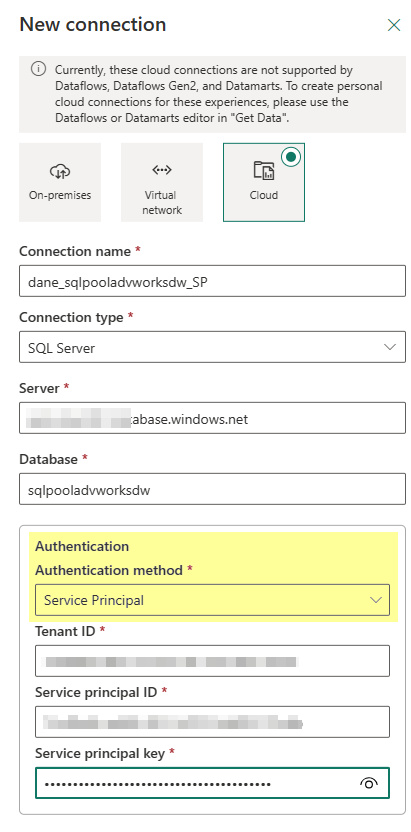
So in the service you click on the Settings gear icon in the top right and select Manage connections and gateways. From there you will click on the +New button in the top left and then configure your Cloud connection like such and you will see under the authentication method you can choose Service Principal!
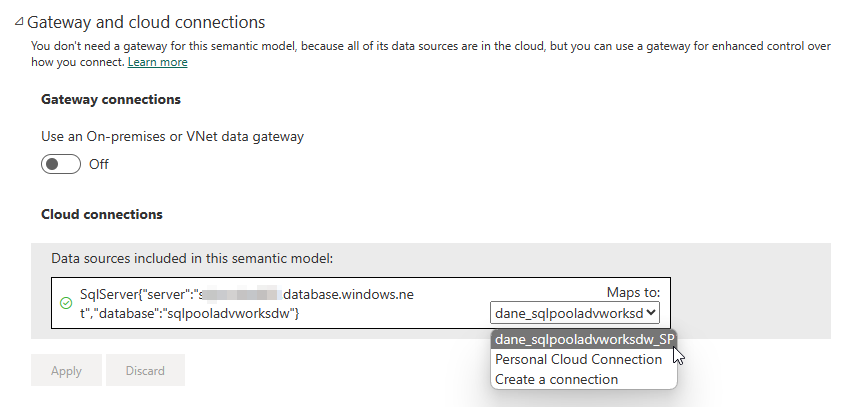
Once you upload your report that is using the similar connection all you need to do is modify the dataset (semantic model) settings and adjust the reference from the personal cloud connection to the shareable cloud connection that you created which is using the Service Principal like in the following screenshot.
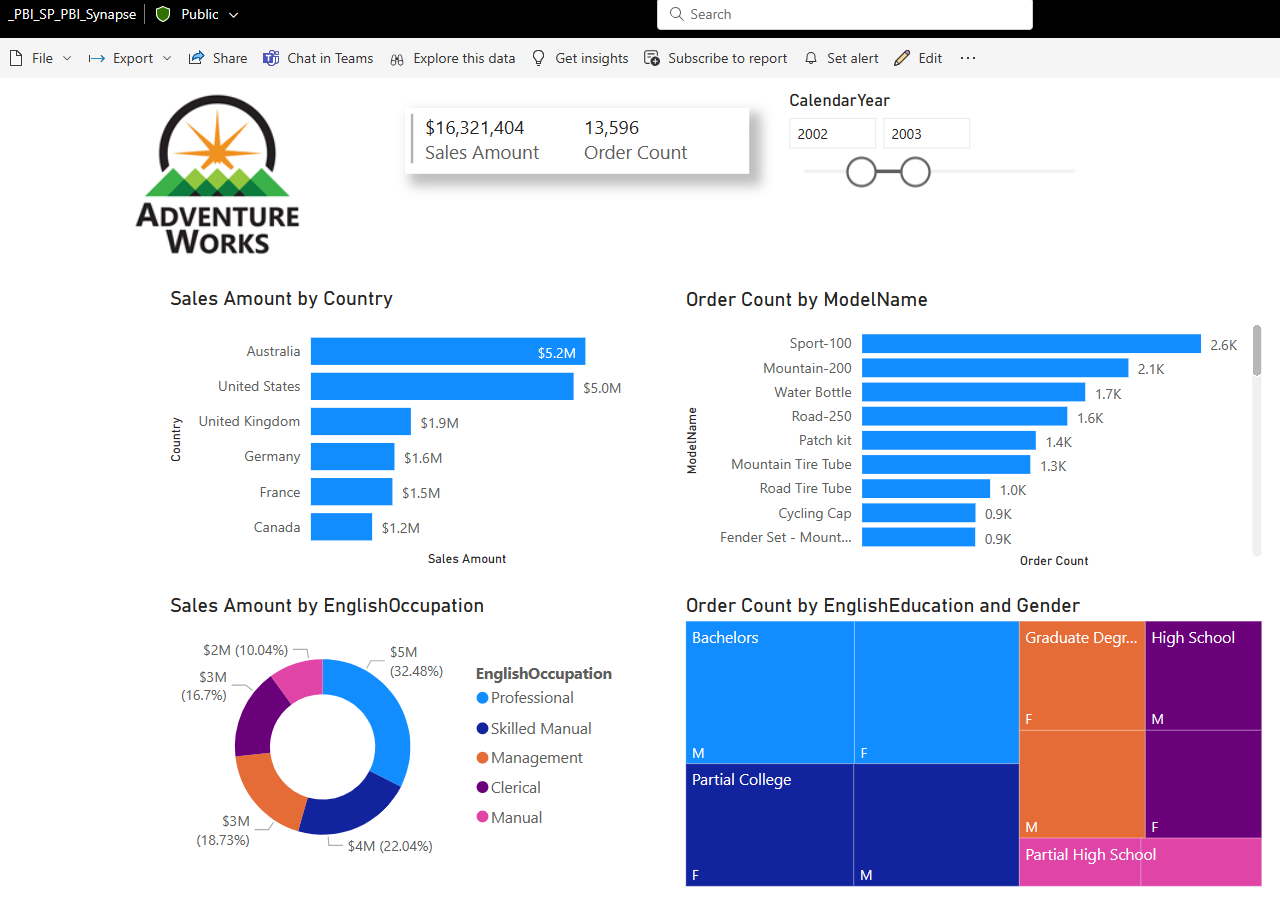
Once that is done you can go back and view your report and everything is good to go!
And you can go ahead and do your refreshes just like you would normally:)
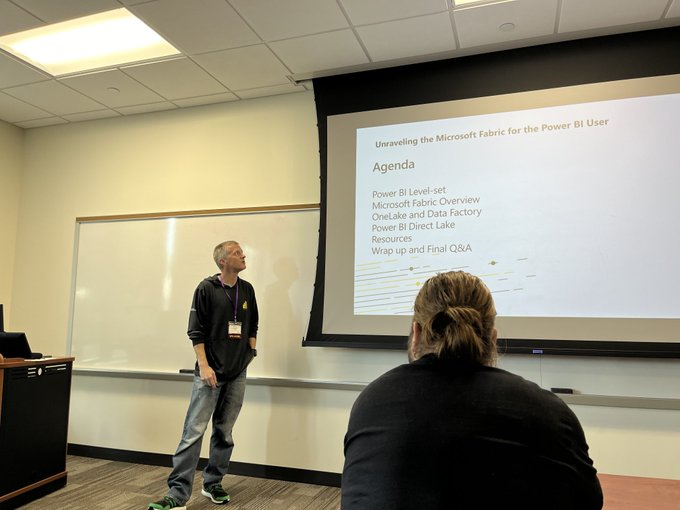
This past weekend I had the pleasure to present at Minnesota SQLSaturday 2023 and it finally returned to in-person event after four years! It was really great to be able to return to normal and have an in-person event again versus just virtual. Now I just have to get used to presenting to people face-to-face, that is a bit different than presenting remotely from the comfort of your home and not being able to typically see anyone.
I want to thank everyone that attended my session on “Unraveling the Microsoft Fabric for the Power BI User”. There were over 30 in the tiny room I was in which ended up being standing room only, apologies to those that even had to sit on the floor. Thanks to those that filled out the evaluation forms, that is greatly appreciated and helps for future presentations. The scores I received (on a 5 point scale) where Overall Session 4.2, Speaker Knowledge 4.6, Presentation Skills 4.0, Demos 3.7, and Learn what you expected 4.1.
I want to apologize since this was my first time back presenting in front of the community it was tough not getting wrapped up in some conversations, answering quite a few questions, and going down a few rabbit holes from time-to-time. I really needed 90 minutes for this talk and of course could have gone on even more. I didn’t account for the event slides added to the beginning and I could have definitely cut down on my intro as well as some of the over, I got a bit carried away and perhaps just the excitement of seeing everyone again.
Thanks to Donald Parish for taking this picture of me presenting wearing my Lego Green Adidas (can’t see my Azure Synapse socks) and the awesome Power BI hoodie.
Note: one thing to mention for presenters, don’t get Invisaligns the week you are planning on doing a session at an event. They are painful and take time to adjust to;) I wasn’t supposed to get them until Oct 10 but they arrived early and they put them in on Sep 26 instead:'(
I thought it was great that everyone in the room with the exception of maybe two were not familiar with Power BI (I did a quick Power BI level-set at the beginning, could have probably glossed over that to save time) and maybe a quarter of the people were familiar with Microsoft Fabric. I probably spent too much time on the Fabric overview and only made it through three of the five planned demos.
It is a challenge at these events to find a balance of content for the audience by providing overview 100 level information versus the attendees that are looking for 200 or 300 level, maybe even 400 level content. If more of the room was familiar with Fabric I could have more or less jumped into demos possibly. Seeing things in action versus just having someone talk about them is what I like, but we all learn differently, so have to find that happy medium.
I will look for an opportunity to present this topic again as well as record my demos or maybe even record the presentation from beginning to end and make available soon and I will post an update when available, for now here is the link to the pdf of the slides “MN SQLSaturday 2023 Unraveling the Microsoft Fabric for the Power BI User“.
Thanks to the PASSMN board for organizing the event as well as the sponsors, volunteers, St Paul College, speakers, and attendees! Hopefully next time we don’t overlap with the Twin Cities Marathon weekend which makes it painful with all of the road closures. My next presentation will be at the Twin Cities M365 Community Days event where I will be presenting on “Power BI Gotchas – Dan’s Dirty Dozen”.
Hello #SQLFamily, we are very excited that this year we will be back in-person for the Minnesota SQLSaturday event that will be held once again at Saint Paul College on September 30th SQL Saturday Minnesota 2023 (#1054).
The schedule for the event has been posted and is available to see here and there are just over 30 sessions and a fantastic line up of speakers coming to present.
I will be presenting on “Unraveling the Microsoft Fabric for the Power BI User” and the description for that session is –
“Are you a Power BI developer? Have you heard about Microsoft Fabric? What are all of these new ‘Data’ experiences – Data Factory, Data Engineering, Data Science, Data Warehousing, oh my and other items such as Data Activator and Real-Time Analytics? Wow! Where did Power BI go?
In this session we will go under the covers and unravel the Microsoft Fabric to help educate Power BI developers on the new capabilities available and provide some guidance on how to get started and skilled up on using these new experiences.”
Last month there was a new update that has been made that provides support for drillthrough report actions in the Power BI service (Microsoft Fabric)! Those of you who are familiar with SQL Server Reporting Services (SSRS) know what a great feature this is to include in your reports to allow users to jump to another report for additional information such as detail level report and even allow the ability to pass the context (parameters) to the report.
Drillthrough was a big item that might have been a blocker for some companies preventing them from migrating from on-prem SSRS or Power BI Report Server (PBIRS) to the Power BI, well not anymore:)
So how does this work? Well very similar to how it does in SSRS/PBIRS with a slight modification that I will highlight. If you are familiar with Actions this works the same, but the “Specify a report:” and “Use these parameters to run the report:” sections have to be done manually, you are not able to use a dropdown to select the report and the parameters will not auto-populate for you.
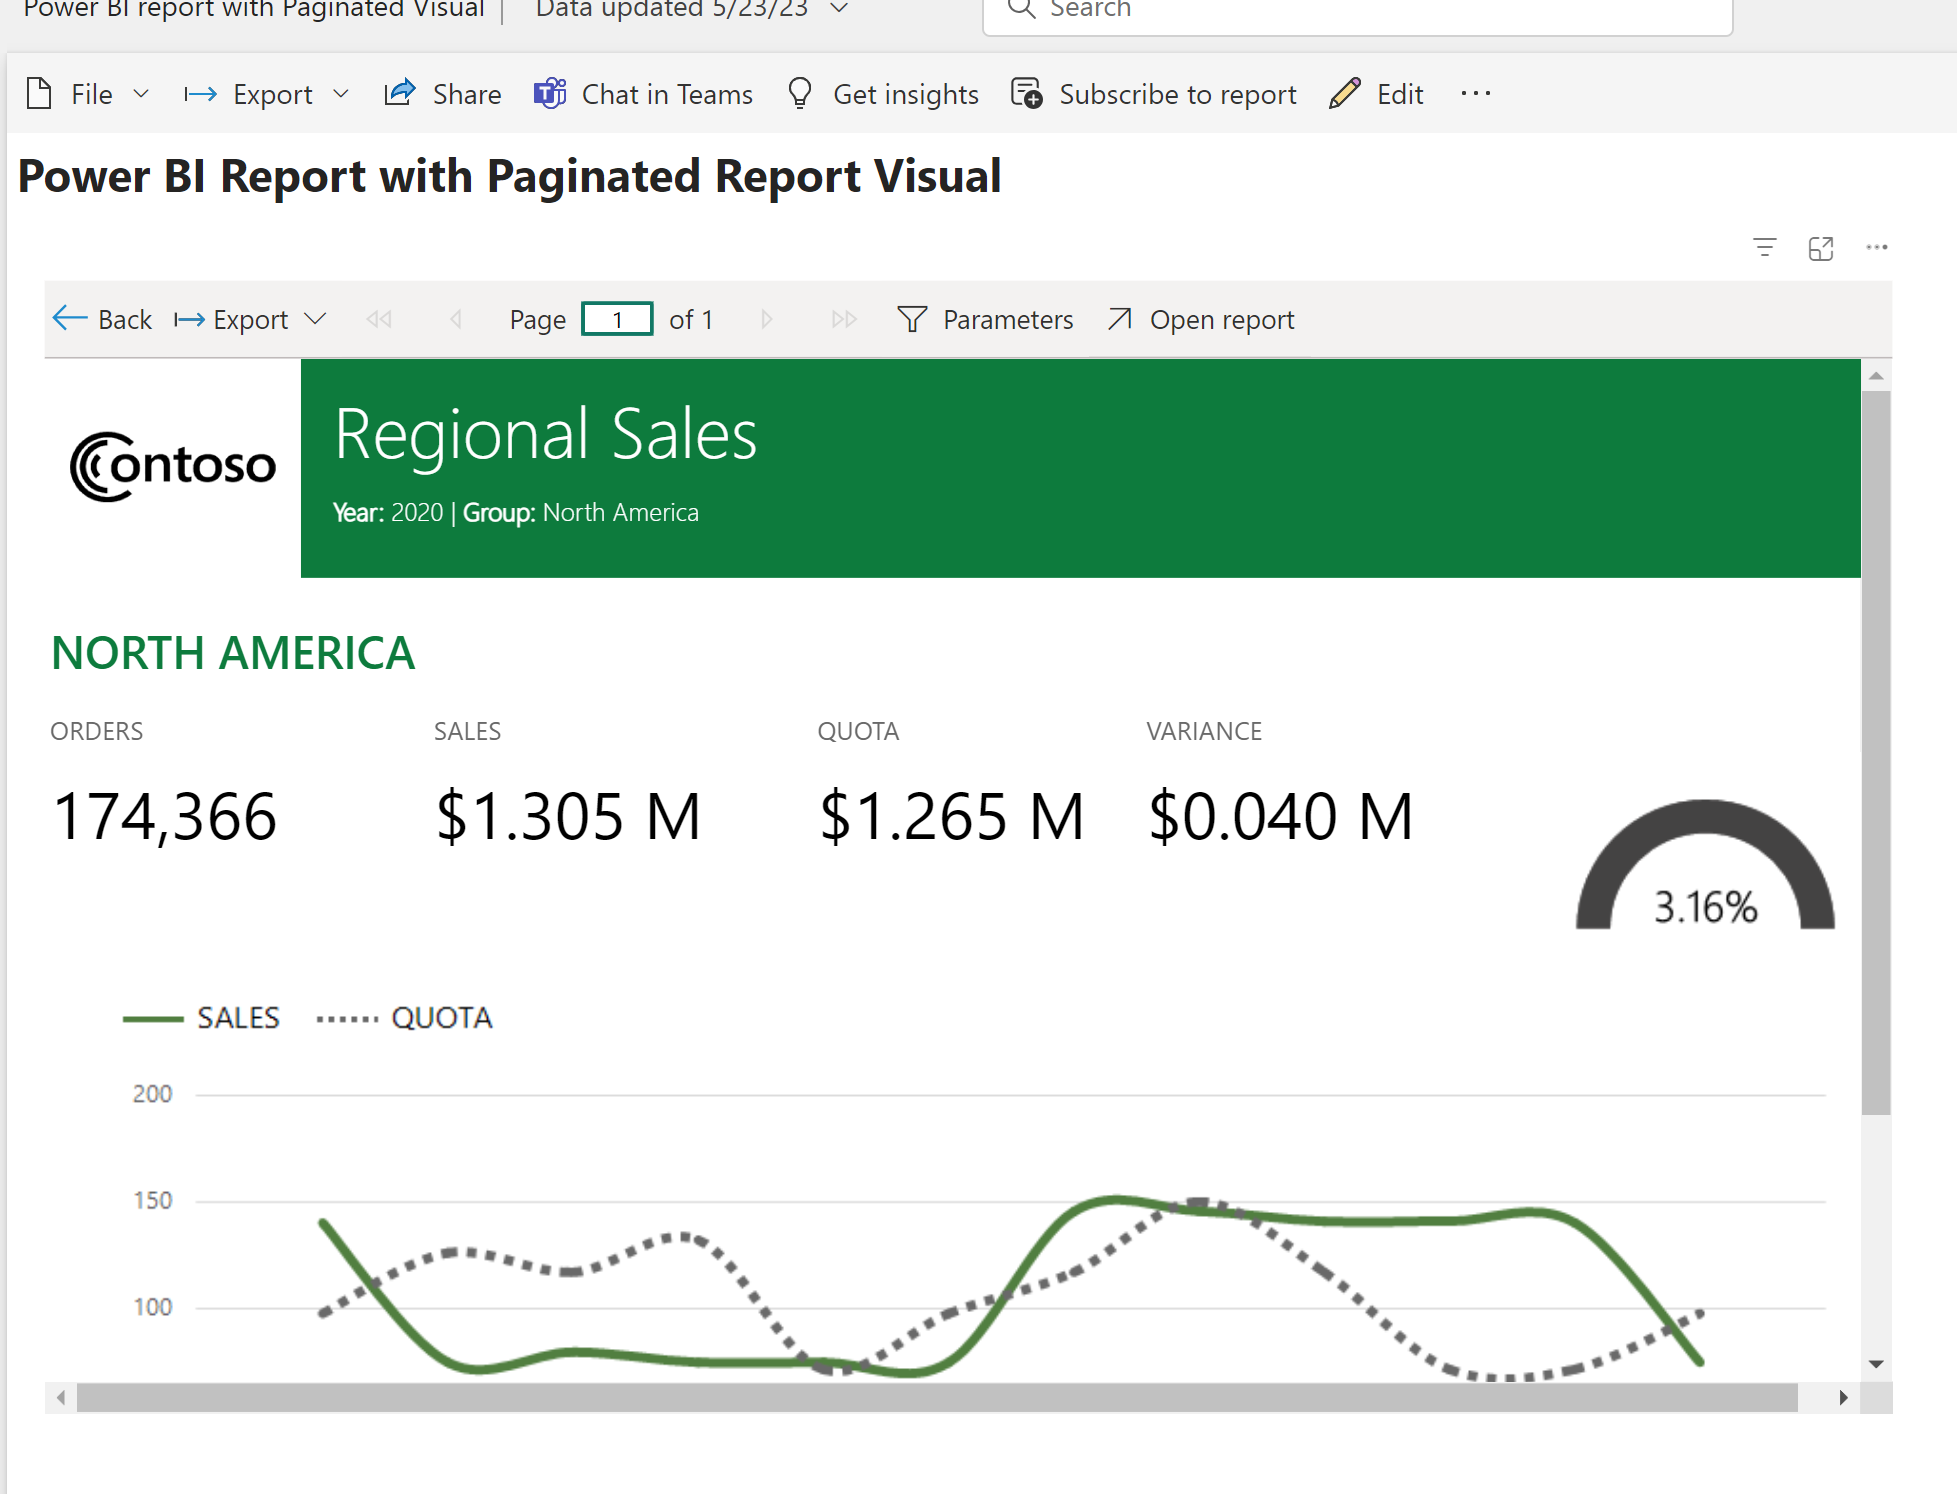
In the sample report above which I downloaded from our Paginated Report samples I updated the SalesTerritoryCountry text box on the CountrySalesPerformance report to “Go to report” (drillthough) RegionalSales. On the RegionalSales report I have two parameters, one for CalendarYear and the other for SalesTerritoryGroup.
Once this is configured you will need to publish both of the reports to the same workspace in the Power BI service and then when you hover over the text box configured with the drillthrough action you will see your icon switch over to the hand indicating that you can click on it like the following screenshot shows when I hover over “NORTH AMERICA” –
When I click on “NORTH AMERICA” then I will get sent to the report configured with the drillthrough RegionalSales and it will pass the corresponding configured parameters in the action and I get a nice little notification since this is the first time I am doing this and it has similar “<- Back” navigation like you are used to with on-prem reports as well as Power BI reports that use drillthrough.
In the toolbar you can view the parameters and see that the values were passed from the parent report, CountrySalesPerformance, and set on the RegionalSales report.
If by chance you click on an item in the parent report that passed parameter values that were not available in the child (drillthrough) report then you would see the following when I click on “PACIFIC” –>
The entire report is blank because “PACIFIC” was not a valid value in the parameter options for Sales Territory Group. So to fix this I would need to review the RegionalSales report, include that value and maybe add some additional handling of no data by setting the “NoRowsMessage” on the tablix region on the report. So now if the user clicks on this option they would see the following –
And in case you were wondering, will this work in a Power BI report within the Paginated Report visual…well it does now and that is why I delayed posting this blog by 3 weeks and have been patiently waiting and testing for this last item to be made available (see below example).
And if you were wondering about how many levels you can go with drillthrough, the answer is 4 levels as documented here where it states the following “In paginated reports, you can drill through reports down to four (4) levels of child reports.”
Another thing to be aware of is if you are using the migration process built into on-prem SSRS or PBIRS that you will no longer get the unsupported feature message (thanks to Cookie McCray for confirming this for me) and this has been removed from the unsupported features section of the FAQ documentation here now.
What do you think about this new capability? Are you excited? Will this now allow you to migrate your reports if this was one of your blockers previously? Would love to know how you are using Paginated reports in the service today and if there is anything else that might be preventing you to migrate to Power BI (Microsoft Fabric) now.
You might be wondering if anything changed and the answer is yes! As part of the process there is now an automated way to handle the Power BI report dataset rebind process after the migration (this does not include Paginated reports). In the February post I showed how you can leverage the API calls and do this manually, well now there is a simple menu option that will do it for you as mentioned in the May post:)
This new rebind report option is available in the AAS database migration details area from the database context menu like shown below
Here you will see three options – Rebind reports, Undo rebind, and Rebind status.
In my example here for the demo after my AAS database migration to a Power BI dataset I have four copies of the report that are in different workspaces – the migration workspace AASMigration, My Workspace, Demo Workspace, and Demo Pro Workspace. Two of the workspaces are Premium – AASMigration and Demo Workspace – and then two are not – My Workspace and Demo Pro Workspace. What we will see is that the new “Rebind reports” process can take care of all reports referencing the existing AAS database across the entire tenant, even workspaces that I might not have permissions to.
Before checking out the new menu options let’s first look at the reports referencing the AdventureWorksAAS_PowerBIRpt dataset that has the Live Connection to the AAS database.
We can see above that there are currently four reports. Now let’s go ahead and test out the new menu options.
When I select the “Rebind reports” option I will get the below pop out panel message (no details since this is the first time I have selected the option).
After a short period of time if I select the “Rebind status” menu option I will see the following –
If I look at the lineage view for the dataset we will see that there are four reports in the four different workspaces now associated with the Power BI dataset that was migrated over from AAS.
I can then go into one of the reports in any of the workspaces and see that the report is working as expected as shown here by opening the report in the “Demo Pro Workspace” that is referencing the dataset in the “AASMigration workspace”. This is using a Pro/Shared workspace going against the dataset that is in a Premium workspace.
If you were just testing out the rebind process or the database migration process you could then go ahead and use the “Undo rebind” process and that will switch the dataset related reports back to the AAS database.
Note: after you run the rebind process it can take a minute to propagate the permissions, so if you try and click on a report immediately after you run the process you might get the following message as shown below – “Permission required – You cannot see the content of this report because you do not have permissions to the underlying dataset. Please contact the dataset owner to request access.” Just be patient and what a minute or two for the permissions to be updated with the source being swapped out within the report.
So that is it for the new Power BI report rebind automation process, pretty cool and saves a lot of time if you have a lot of reports. The nice option is if for some reason you do the rebind and there is an issue you can always use the undo option and revert back;)
So what do you think? Have you tried the AAS migration process yet? If so I would love to hear your feedback and experience, please leave a comment below!
If you have existing Power BI reports using the AAS live connection you are able to use the report rebind API to point the report to use the Power BI dataset. The one thing to note as pointed out in the documentation is that as of now if you need to modify the report layout you would need to do that directly in the service. That portion of the migration process is still being worked on and hopefully should be updated to resolve the issue so that you will be able to download the redirected report from the service, modify it, and then publish the report back to the Power BI service.
In this post I want to touch on this a bit more and provide some follow up based on work that has taken place since that post on the migration rebind (redirection) process.
In my Power BI workspace I have two reports that are connected to my original AAS database used in the migration process, one is a Power BI report and the other is a Paginated (Operational) report.
If we look at the lineage view we can see that both reports are referencing Analysis Services –
I have already gone through the AAS to PBI Premium migration and moved the database from Azure Analysis Services to the Power BI Premium workspace shown above and it is named ‘AdventureWorksLTAAS’ as shown below in the screenshot.
Now what we can do is use the APIs to redirect both reports from using AAS so that they use the new Power BI dataset. Since I have to different types of reports I will be using two different APIs and we will start with the Power BI Report. To do this I will open up Windows PowerShell ISE as Administrator, login to Power BI, and then call the Report Rebind in Group API. Below is the outline of the steps to use and I included the install of the Power BI modules as well. You would need to include the values of the new dataset, workspace, and report and remove the square brackets.
#STEP 1: run PowerShell as Administrator

#STEP 2: run script if you don't have this module installed, might get prompted to install library
If (!(Get-module MicrosoftPowerBIMgmt)) {
Install-Module -Name MicrosoftPowerBIMgmt
}

#STEP 3: login to service (you will get prompted)
Login-PowerBIServiceAccount

#STEP 4: rebind report to Power BI dataset (new model)
$body = @{ "datasetId" = "[new dataset id]" }
Invoke-PowerBIRestMethod -Method Post -Url "https://api.powerbi.com/v1.0/myorg/groups/[workspace id]/reports/[report id]/Rebind" -Body ($body|ConvertTo-Json)
Once this is completed you will see that the lineage view has changed for the Power BI report so it is now referencing the Power BI dataset that was created as a result of the AAS database migration.
Now we will do a similar process with the Paginated report, but for this you need to use the Update Datasources in Group API since this is an RDL report file. Below is the code used for this in PowerShell and you would need to provide the corresponding values for the datasource name, workspace XMLA endpoint, dataset name, workspace, and report and remove the square brackets.
#STEP 1: run PowerShell as Administrator

#STEP 2: run script if you don't have this module installed, might get prompted to install library
If (!(Get-module MicrosoftPowerBIMgmt)) {
Install-Module -Name MicrosoftPowerBIMgmt
}

#STEP 3: login to service (you will get prompted)
Login-PowerBIServiceAccount

#STEP 4: rebind report datasource to Power BI dataset (new model)
$body = '{
"updateDetails":[
{
"datasourceName": "[datasource name]",
"connectionDetails": {
"server": "[workspace xmla endpoint]",
"database": "[dataset name]"
}
}
]
}'

Invoke-PowerBIRestMethod -Method Post -Url "https://api.powerbi.com/v1.0/myorg/groups/[workspace id]/reports/[report id]/Default.UpdateDatasources" -Body $body
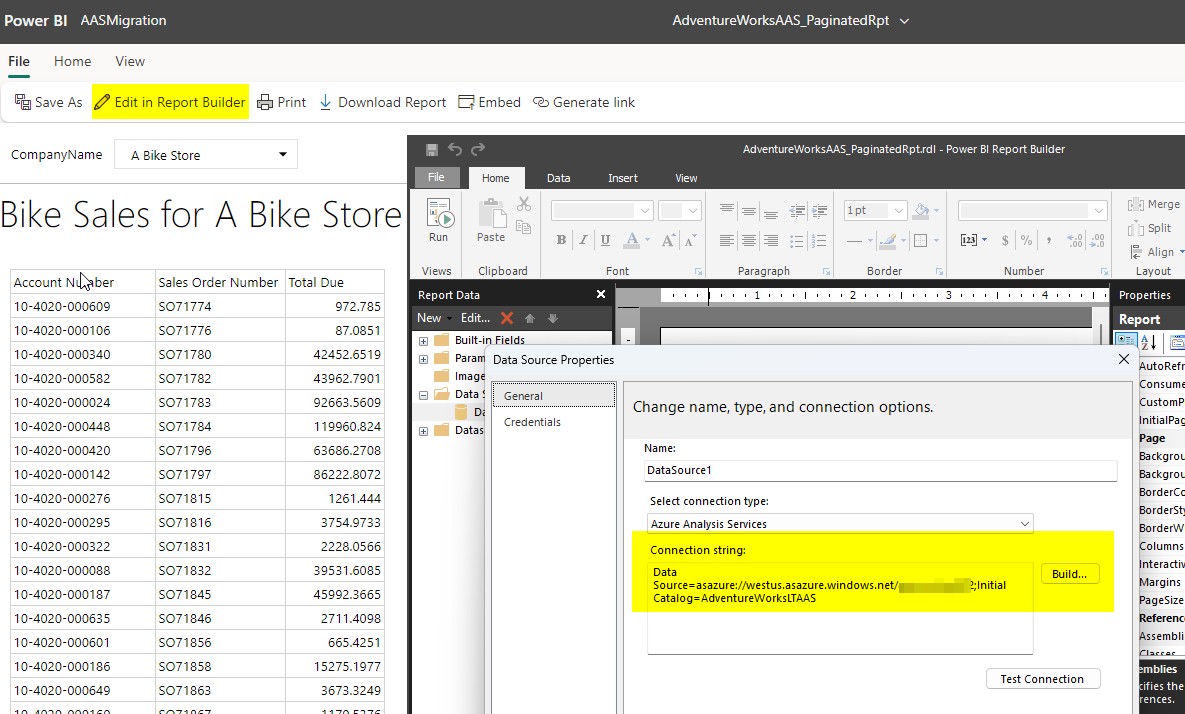
The one thing to note about this process for the Paginated report is that the actual RDL file doesn’t get modified. So if you were to download the file or use the option in the service to “Edit in Report Builder” you would still see the AAS information. If you view the lineage though you will see that it is referencing the Power BI workspace now via the XMLA endpoint as shown below.
So an alternate option if you actually want the Paginated report file definition updated would be to use the “Edit in Report Builder” option and change the actual information or update the file that you might have in source control and simply republish.
Now the final thing I want to wrap this post up with is the issue regarding modifying the Power BI report files as I mentioned in my previous post as well as which is highlighted in the “Import Considerations” section of the AAS migration documentation.
During preview, if you use the Reports – Rebind Report Power BI REST API to create a new binding to the migrated dataset, you can’t make changes to reports in a Power BI Desktop .pbix that were previously bound to the model in Azure Analysis Services and then republish to Power BI. Report changes for a migrated dataset can be made in the Power BI service.
What you will see if you download the Power BI report file from the service, modify it, and then try to publish it back to the workspace is the following message.
This is the item that was being worked on and I am happy to announce an update is currently being deployed to resolve this. This update is in the process of being deployed to the service so it will take some time to make it available in all regions, but once it is what you will be able to do is use the “Upload” option in the workspace to get your updated file available.
There is of course still the option to simply update the files directly in the service as mentioned. The other fix that is coming and will be available in the March Power BI Desktop release is to resolve the dialog message above “Couldn’t publish to Power BI” when you publish.
With the March release you will see the following message when you publish your report that you downloaded after the report rebind and want to publish changes back to the service.
That is what we like to see:)
So I would be curious, has anyone been using the AAS to Power BI Premium migration process? If so, what has your experience been and what kind of feedback do you have? Feel free to leave a comment, I would be very curious to know more about your journey!
Being able to publish Analysis Services databases to Power BI Premium has been available to do previously, but this feature makes the option easier. In order to use this feature make sure you read over the prerequisites and information about the migration experience (I highly recommend reviewing this prior to actually attempting to do a migration) Migrate Azure Analysis Services to Power BI. I also got to help review and provide feedback about this documentation as well, so if anything appears to be missing or needs more explanation please use the Feedback option at the bottom of the page.
Some key items that I like about the new experience versus simply doing this manually on your own is the following:
Automates the process of backing up AAS database, copying the backup to ADLS Power BI storage, and then restoring the database which becomes the Power BI dataset
This will not only migrate 1500 compatibility mode models but also 1200 without any issues
It will migrate the roles and permissions over, so database Admins will have write permissions on the dataset and other users will have build permissions
The other item once you have migrated the databases over is the ability to enable the AAS server redirection
AAS server redirection, what does that do you? Well, let’s say that you have users that might have created a bunch of PivotTable reports in Excel against the AAS database. As part of the migration experience you will now be able to simply redirect all of these users to the Power BI dataset and they won’t have to make any changes in their Excel file connections or even have to know that anything changed. All with a click of a button! Wow, pretty cool huh? And once the server redirection is enabled you can actually pause the AAS service and all external client applications, tools, and automated processes will simply get redirected to the Power BI dataset.
If the redirection is not working refer to the documentation link for the client library minimum requirements, initially the redirection wasn’t working with my click-to-run (C2R) install of Excel but with a recent update this past month it now has the updated msolap library:) Actually I ran into an issue with my Office install and to resolve the issue the online repair uninstalled and reinstalled my Office which not only fixed my issue but also allowed me to go with the 64bit version of Office and provide the updated Excel and msolap library;) For Excel (at least the C2R version) you can find the msolap version in the following location –> %programfiles%\Microsoft Office\root\vfs\ProgramFilesX86\Microsoft Analysis Services\AS OLEDB\140
I won’t go over all of the steps of the migration process since those are covered in the documentation as well as shown in the video links above but if you try and create a new migration and get the following message “You don’t have permission to access to the server” as shown below it is most likely that you don’t have owner or contributor access to the AAS service in Azure, so verify that.
And after you create the migration in the Power BI service it might not be obvious but to begin the process you need to click on the AAS server name to review the configuration and to start the database migration process.
Once you access the migration you need to make sure that the AAS server is started and running, otherwise if it is paused you will get the following error message
On the migration page details screen you will see all of the configuration information for the AAS server as well as the Premium workspace and a list of the databases that are available to migrate.
If something is not configured properly as per the prerequisites you will get a warning message letting you know like if you don’t have storage configured for either the AAS server or workspace. This is a requirement for the backup and restore process to complete successfully.
If you try to migrate an AAS database that is larger than the Power BI Premium capacity will allow you will get a message like the following during the attempt to restore the backup file to the workspace. In this case I am trying to restore a database that is larger than 3GB to an A1 SKU which has a 3GB limit and this fails. So make sure that the capacity you are migrating to will support the databases you want to move. You can see the details and progress of the migration if you click on the database name when the migration process starts.
Currently a blank dataset will be created after the above failure in the workspace and it won’t contain any metadata – something that should probably be cleaned up and is a bit unexpected.
If the database does successfully restore then you will be able to start using it to create reports off of and once everything is migrated over you can enable the server redirection so that all of the external connections will start using the Power BI datasets and then you can pause the AAS server.
Once the AAS server is paused after the redirection is enabled you will see that the Excel PivotTables will still continue to work without having to make any changes to the connection string information.
Now that redirection is enabled I pause the AAS server and then change the slicer selection in the Excel PivotTable and the report still works as expected. You might get prompted for authentication and then the other thing you will see is if you are using sensitivity labels in Power BI that the file will inherit that as well.
If you have existing Power BI reports using the AAS live connection you are able to use the report rebind API to point the report to use the Power BI dataset. The one thing to note as pointed out in the documentation is that as of now if you need to modify the report layout you would need to do that directly in the service. That portion of the migration process is still being worked on and hopefully should be updated to resolve the issue so that you will be able to download the redirected report from the service, modify it, and then publish the report back to the Power BI service.
If you are currently using SSAS or AAS and haven’t moved your models to Power BI Premium I would definitely try it out and this new migration experience definitely simplifies the process. Please provide feedback and let us know about your experience.
In this post I just wanted to show the ability to use the Delta Lake format that is very common now with Power BI. I will go over a quick example of creating the files to reference, building a view to use with Power BI, and then querying the data in Power BI.
In my Synapse Workspace I created a Linked service connection to an Azure SQL Database that has the AdventureWorksLT database loaded which is the sample database you can create when you first create a SQL instance in Azure and here is a walkthrough link and see the Additional settings section.
I am going to use this database as the source to generate the Delta Lake format files in an Azure Data Lake storage account. To do this I created a Data flow in my Synapse Workspace and referenced two tables as my source, one being the Product table and the other the Product Category table. Really basic example, just really want to highlight the ability to easily reference the Delta Lake format files that are in the storage account within Power BI.
Synapse Data flow screenshot
On the source side I am referencing the Linked server connection that I already established against the AdventureWorksLT sample database in Azure SQL as you can see below in the Source settings and above you can see I am actually providing a query to simply extract just the columns I am interested in on the Source options tab.
Synapse Data flow source settings screenshot
This setup is done for both the sources in the Data flow and then on the sink side the target destination is going to be an Azure Data Lake storage account. For the Inline dataset type I specified Delta.
Synapse Data flow sink screenshot
And on the sink settings tab you just need to provide the folder path and compression information as shown below for where the product table Delta Lake files will land.
Synapse Data flow sink settings screenshot
After the Data flow is configured and in this example I am just doing the Product and Product Category tables then add the Data flow into a Synapse Pipeline and Trigger the Pipeline to run to create the files in the Azure Data Lake. After you add the Data flow activity to the Pipeline you just need to configure the settings as shown below and then under Add trigger do the Trigger now option. This should just take a few minutes to run to queue the job and spin up the resources.
Synapse Pipeline Data flow screenshot
Now in the Synapse Workspace I can go into the Data hub and view the files that are in the linked data lake storage account as shown below.
Synapse Data hub linked data lake screenshot
With the files in the Azure Data Lake we are now going to reference these with the Synapse Serverless Pool. To make it easier to reference these in Power BI I will actually create a view that combines the data from both tables to include the columns of information that I want for my report. The first thing will be to create a database in the Synapse Serverless Pool and this will store the view that we will reference in the report.
Synapse SQL Serverless script screenshot
In the screenshot above I have the script to create the database. After that gets created as you can see in the screenshot in the top-right I connect to that database and then that is when the script to create the view is run.
If you query the view or run the SELECT statement above you will see the results as shown below in the screenshot.
Query results from Delta Lake format files in ADLS screenshot
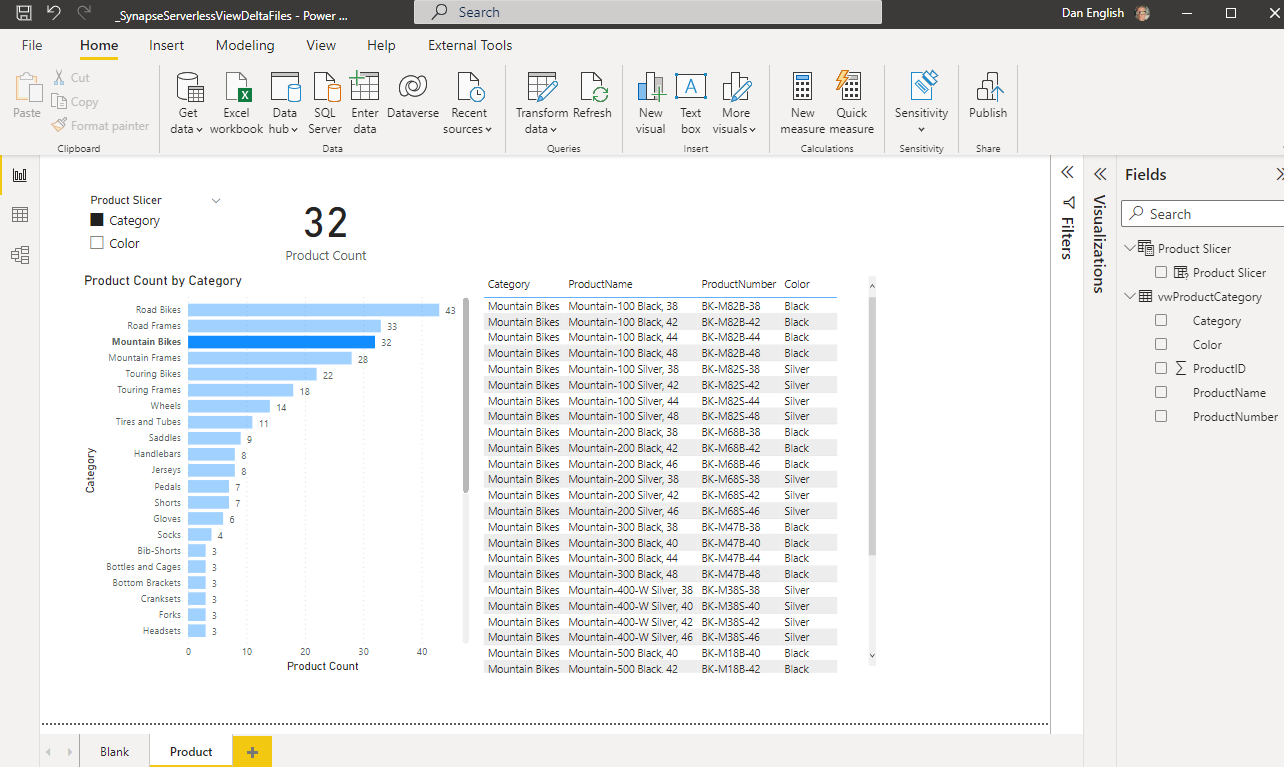
In Power BI Desktop now you can Get Data and by using the Synapse Serverless SQL endpoint that you can get from the Azure portal on the Synapse Workspace Overview page you can make a connection to the servless_ondemand database we created and select the vwProductCategory view to include in the report.
Power BI Desktop Get Data Synapse Serverless SQL screenshot
By know means is this a great end to end example, just simply show casing the ability to reference the Delta Lake format files in Power BI, but you can create a report and in DirectQuery mode query and interact with the information that is in the Azure Data Lake with Synapse Serverless Pool that is stored in Delta Lake format!
Power BI Desktop report screenshot
This was a pretty brief overview, but hope you can see the possibilities of using the Synapse Serverless capabilities to easily reference the data in an Azure Data Lake and query the data directly using Power BI and in doing this we even created a view that joined the data from two different tables (files) in the lake!


 Subscribe to Blog feed