PerformancePoint 2010 Cascading & Apply Filters – SP1 Features
Posted by denglishbi on June 29, 2011
I downloaded and installed SharePoint 2010 SP1 so I could check out the new additions the PerformancePoint. Typically you would only see hotfixes included in a service pack, but in this one we get a few new features like cascading filters and a new apply filters button (with saving defaults filter) options. Let’s take a quick tour of these new features to see how you use them and what they do to your dashboard pages.
Cascading Filters
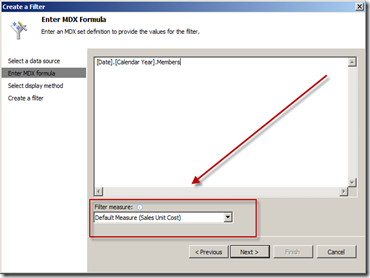
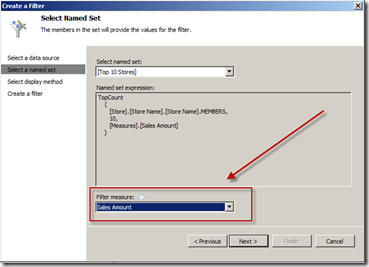
This is not a new concept, but for PerformancePoint it is. In Reporting Services you have always had the ability to setup parameters so that the selection in one parameter list would be able to filter the available values in another parameter list. Well now this has been added to PerformancePoint and it is available with the Multidimensional Filter types – Member Selection, MDX Query, and Named Set filter types. When you go to create a new filter of one of these types you will see a new setting in them. This new option is to select a measure (metric) that will be used to pass a query to the other filter to return the list of available values that satisfy that query.
Member Selection
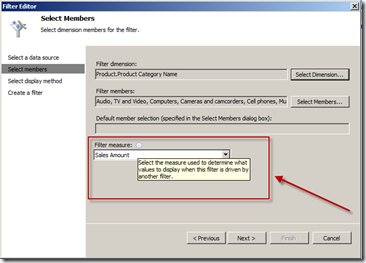
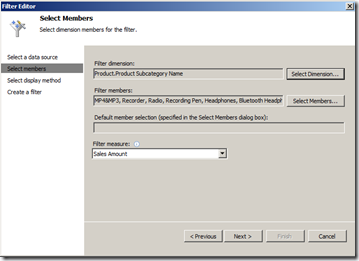
The new selection is the ‘Filter measure:’ option and the informational dialog box states the following:
Select the measure used to determine which values to display when this filter is driven by another filter.
This is the measure (metric) that will be used in combination with the filter member values passed to this filter to display the available list of values to the end-user to select from. So if I had a filter that was for Product Category and passed that to another filter that was Product Subcategory and the Product Subcategory was configured with ‘Sales Amount’ measure then the Product Subcategory filter would display a list of items that had ‘Sales Amount’ for the Product Category items that were selected. A tad bit confusing perhaps, but this is how it works.
MDX Query
Named Set
This option is not available with the other filter types, just the ones displayed above – Member Selection, MDX Query, and the Named Set.
Ok, so now that you have a tour of that new option lets setup a dashboard with a couple of filters and a report.
Create Filters
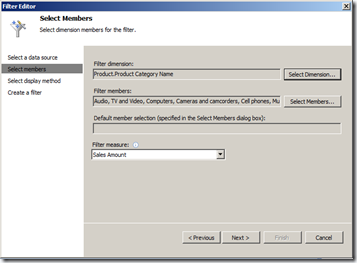
Member Selection – Product Category
Member Selection – Product Subcategory
Create Analytical Grid Report
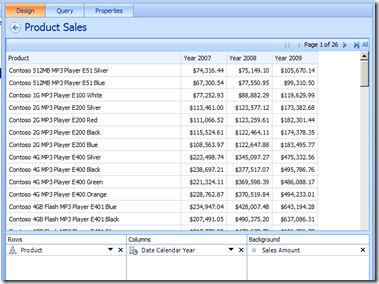
In this report I used the Product hierarchy and chose only the Product Name descendants of All, picked the Calendar Year hierarchy, and placed the Sales Amount measure in the background. I also used the filter option to remove blank rows and columns.
Create Dashboard and Connect the Items
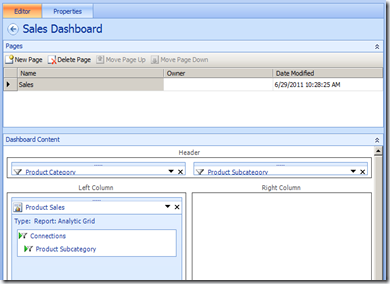
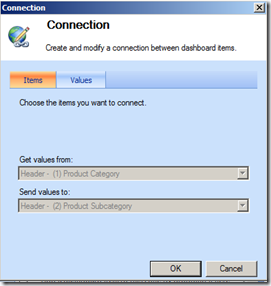
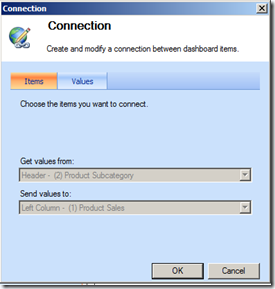
For the connections I connected the two filters together and then connected the Product Subcategory to the Product Sales report.
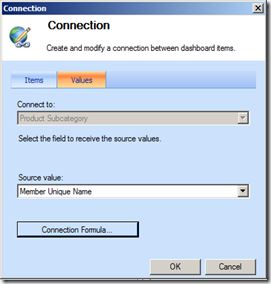
Connection to the Product Subcategory filter
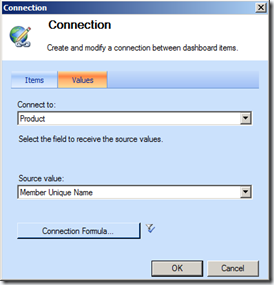
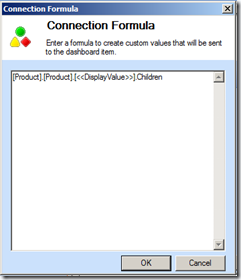
Connection to the Product Sales Analytical Grid Report – uses a connection formula as well
In this example I am leveraging a Connection Formula. The reason I am doing this is because the hierarchies that are involved in this example. I am not referencing the same hierarchy in each item and I want to be able to display the product names in the report instead of the subcategory values. So I am taking the display name in the subcategory filter and using that in a formula to return the children (product names) in the report.
Deployed Dashboard in SharePoint
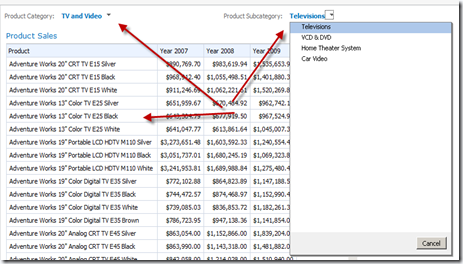
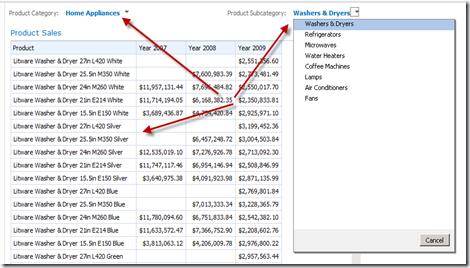
You can see that the subcategory filter is filtered by the category filter and only the ‘Tv and Video’ subcategory members are being listed. The subcategory filter selection is also filtering the report which is displaying all of the product names that are associated with the ‘Television’ subcategory.
If we make another selection in the category list we will see everything get updated again.
Pretty slick.
Ok, now on to the other new feature that was added into the service pack 1 – Apply Filters Button.
Apply Filters Button
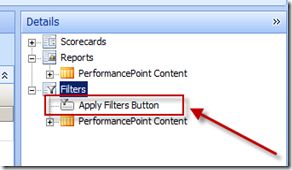
When you setup a dashboard now you will see a new selection in the Details pane in the Filters section called ‘Apply Filters Button’.
So what is this for? Hmmm, is this something similar to Reporting Services perhaps? Answer – Yes, with an added bonus.
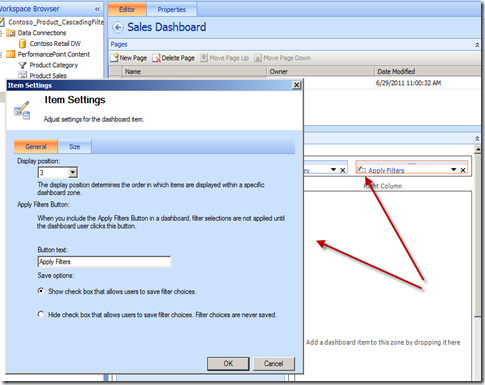
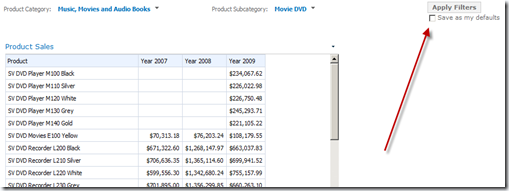
If you drag and drop this onto the dashboard page and go into the edit settings for this new item you will get some options you can configure. The first one is the text that you would like to be displayed on the dashboard page for the button. And the next one is whether or not you would like to provide a checkbox for the end users to be able to save their selections for this dashboard page – this will be stored as their default values for these filters. This means that when they come back to this page at a later time these filter selections will automatically be selected for them. In the past the last selection of items from the filters was always saved and stored for the users, but now they have the control to determine which values get saved (if you want them to – optional).
The other thing about this new feature is that when you make selections from the filters the items in the dashboard (with the exception of linked filters) will not be filtered. In order to get the other items to filter on the dashboard you need to click the button. Once you do this your scorecards and reports will refresh and display the data based on the selections in the filters (assuming they are connected of course).
I was hoping that this feature might somehow allow you to retain your default member selection settings in the initial filter setup, but that does not appear to be the case. The application still retains the last selection by the user unless you provide them the ability to save their own defaults with the new ‘Apply Filters Button’ option.
Anyway, these are just a couple of the new features along with hotfixes that are available in service pack 1.
Check out more information here:
Enjoy!
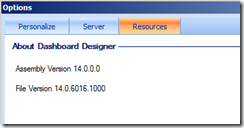
By the way, after I upgraded to SP1 the build version of Dashboard Designer was the following:
14.0.6016.1000
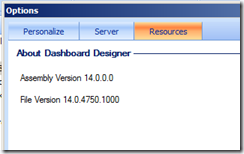
Prior to the upgrade it was:
14.0.4750.1000
I had installed a hotfix prior to doing the service pack 1 install. I wanted to check out some other fixes before this release – PerformancePoint Services 2010 (PPS) Hotfixes.


 Subscribe to Blog feed
Bryant Avey said
Nice Post. Thanks Dan.
Clayton Groom said
Excellent Summary Dan. Thanks! The Apply filters button will be much appreciated by most of my customers.
Jen Underwood said
This is exactly what I wanted to see!!! Thank you Dan – I love your blog.
-Jen Underwood
What’s coming in SP1 for PerformancePoint | James Serra's Blog said
[…] 2010 Service Pack 1 Availability. Detailed description of some of the new features is at PerformancePoint 2010 Cascading & Apply Filters – SP1 Features. Share […]
gab said
can you only connect to the default view of a sharepoint list? Is it possible to connect to a different view?
PerformancePoint Services 2010 – Cascading Filter Features | FUTURESULTS, LLC Blog said
[…] For another example, check out Dan English’s BI Blog post. […]
Meera said
Hi Dan,
Is there any automated option to Import the PerformancePoint Content (Dashboard/Reports) from one site to another site in SharePoint 2010?
Appreciate your help.
Thanks
Meera
denglishbi said
One option is to use Dashboard Desinger with a workspace file, https://denglishbi.wordpress.com/2010/11/20/migrating-performancepoint-2010-content-to-new-server/. The other option is to use the Content Deployment tool that is available on CodePlex – http://ppscd.codeplex.com/.
anand singh said
While connecting the filter to each other i am not getting the the filter’s name in the connection dialog box for the “Send value to” what can be the issue behind this….. need help on it soon…..
Wade Dorrell said
Thanks for the post Dan.
Mark Stacey said
So, just a warning about this.
Installing SP1 for Sharepoint breaks Filter connections to standard Sharepoint webparts, such as Document libraries.
Hoping they fix it in a hotfix sooon….
denglishbi said
Thanks for the info, very interesting, I don’t do a lot of filter connections outside of the dashboard components. Do you have this posted with the team, any feedback yet? Notice any other issues with SP1 at all.
Colin Doc' Sobers said
Hi Dan. Great post! I’ve been waiting for this for awhile. I use Cascading Parms in SSRS all the time. I have a question though about this particular Scenario: I have 4 Filters: AsOfDate; Center; Tenant and Lease. The Center is filtered based on the AsOfDate, the Tenant is filtered based on the Center, but the Lease can exist in multiple centers for the same Tenant. So when I link to Tenant to the Lease, it brings back all the Leases for the Tenant which is not the behavior that I want.
I want to have the Lease also use the AsOfDate, Center and Tenant Filters to determine what it brings back which should be only 1 Lease for the Center requested.
How would I go about getting this to work.
Thanks in advance.
Colin
denglishbi said
So you found the issue with the cascading filters:) You are correct, this is an issue as you have discovered. Currently you can only have a single connection between filters and in your case you need to be able to apply multiple. I have posted this on the PPS Team’s blog post in regards to cascading filters, but have not heard any responses. Seems like a user defined hierarchy of Center, Tenant, and Lease would be the best bet for you in this case and have two filters on the page where the date would filter your hierarchy. Not what you are looking for exactly, but the best you can do in this case off the top of my head.
Colin Doc' Sobers said
Dan, Thanks for the suggestion. I’ll give that a go. Hopefully, I’ll see you at SQL PASS in WA if you’ll be in attendance!
Colin
Rachel said
Dan,
Thank you so much for the great blog on Cascading filters. I’m currently trying to do this functionality in Performance Point and the cascading works on Performance Point reports/grids, but not on the scorecards. Please let me know if there is a trick to getting this portion to work correctly. We have installed service pack 1 and our Sharepoint 2010 includes the latest version/patches.
Any and all suggestions would be greatly appreciated!
Thank you in advance,
Rachel
denglishbi said
What do you mean it doesn’t work on scorecards? Can you provide some details on how you have your dashboard designed and how you have the connections configured between the filters and the scorecard? You shouldn’t have any issues using this setup with scorecards versus the analytical records types.
Mike Williams said
Have you noticed issues with the filter selections on the last filter not being saved, even if you use the “Save as Defaults” option on the Apply Filters button? We have a multi level hierarchy based around geography. We created a series of cascading filters populated by MDX decendents function at each level in the hierarchy (decendents([dimname].[hiername],1,SELF), decendents([dimname].[hiername],2,SELF) etc…), and tied the filters together using the member uniquename and the hierarchy name. The last filter was tied to the reports which included the same hierarchy.
It worked with no problems. However, the selections on the lowest level filter always default to the first item in the list when changing pages. The higher level filters seem to preserve the user selections, even if you didn’t have an “Apply Filter” button on the page.
These cascading filters is would be perfect if I can resolve this issue. We would go to a single filter where the users simply drills down to the members required, but we have 60,000+ locations at the lowest level so we can’t populate a single filter due to the 5000 member limit.
Thanks, Mike
Virang Shah said
Even we are facing the similar issue. However the last filter in the set of cascading filter seems to be working fine in test and developement environment, it is not able to persist the user selection in Live environment.
Did you find out anyway to resolve this issue. Please help on this issue. I’ve been following your post at this link also: http://social.msdn.microsoft.com/Forums/en/sharepoint2010general/thread/d7209a10-883f-4329-a005-88a219540cd1
If you are able to resolve the issue than please put the resolution at the above link as i can’t access this link through my company’s network.
Thanks,
Virang Shah
anand singh said
Dan.
Thank you for your last solution to my problem which really helped me alot for the cascading filter
One serious problem that i have been facing. the problem goes like this…….. i one time intelligence filter which say last 6 months, last 3 months n so on…. the time intelligence is connected to the month filter. so when i say last 12 month it doesn’t select all the value that has been filter by the cascading connection….. so wat can u do to select all the value tat s in the month filter(member selection).
Thank u in advance
Polo said
Hello Dan,
I have made an application PPS in SharePoint with SP1 and other application made in Sharepoint without SP1. The application or workspace made with SP1 load without problems. However, that was done without SP1 will not let me do anything about it or create a simple connection. I get the following error message:
Unable to connect to the specified server. Make sure the address is correct.
The question is whether an application made in PPS without SP1 works on an installation with SP1.
Thanks
denglishbi said
Was the content and dashboard created prior to the upgrade or was it built on a separate environment? Did you import the content from the non-SP1 into the environment with SP1? There is no reason it shouldn’t work, you just need to import the content and you should be fine. I have pre-SP1 content running just fine and have customers doing so as well.
Wissem Habboub said
Thanks man, nice post
any idea about customization of Default value of the filter (ex: default value depending on the current user)
hua yang said
Hello Dan,
I have a hierarchy UNSPSC segment->UNSPS Family->UNSPS class.
The key column for UNSPS segment is segment Code,
the key column for UNSPSC Family level is segment code + Family code;
and key column for UNSPSC Class is segment code + Family code + UNSPSC class code
when I tried to create a cascading filters for those three level, I got the following error
An unexpected error occurred. Error 40986.
Exception details:
Microsoft.AnalysisServices.AdomdClient.AdomdErrorResponseException: The Category hierarchy is used more than once in the Crossjoin function.
at Microsoft.AnalysisServices.AdomdClient.AdomdConnection.XmlaClientProvider.Microsoft.AnalysisServices.AdomdClient.IExecuteProvider.ExecuteMultidimensional(ICommandContentProvider contentProvider, AdomdPropertyCollection commandProperties, IDataParameterCollection parameters)
at Microsoft.AnalysisServices.AdomdClient.AdomdCommand.ExecuteCellSet()
at Microsoft.PerformancePoint.Scorecards.DataSourceProviders.OlapUtils.ExecuteSingleAxisMemberQuery(String singleAxisMemberQuery)
I have created a cascading filter using adventure works sample. It works. My question is the cascading filter works for my case?
Thank you!
Hua
denglishbi said
Could you provide some details as to how you have the filters setup that you are trying to use against each other? You already have a hierarchy, are you using that in the cascading filter against the same members possibly? Guess I need more details as to how you have this configured to provide you any resolution.
hua yang said
Dan,
Thank you for your quick response.
This is how I did;
I selected members(except All member) of top level (UNSPSC segment) as my first filter. Then created UnspscFamily filter by selecting children of each member of top level segment. I then connected them with “Member Unique name” of first filter to second filter UNSPSCFamily.
thanks
Hua
iTooAm said
Dan – Great Post! Just curious – did you get to hear from the PPS Team if they have any updates on letting a Cascading Filter to accept more than one input connection? This is a real disappointment in few scenarios.
denglishbi said
Thanks and I have not heard anything about allowing multiple connections unfortunately.
Ariel Devoto's Repo How to install Performance Point SP1 said
[…] https://denglishbi.wordpress.com/2011/06/29/performancepoint-2010-cascading-apply-filters-sp1-feature… […]
Erika Gil said
Greetings Dan,
We have a problem with this topic, we have SharePoint Server 2010 Enterprise Version installed. The PPS service seems to be working fine but we followed yours recommendations in the post above and we’ve installed the hotfixes and the SharePoint 2010 SP1 as you said. But we really need your help because have been IMPOSIBLE for us link two filters in the PPS Designer, we’ve already checked the cube and herarchies within and they are perfect. If you could help us! What can we check or verify in the server?
denglishbi said
First I would check the build number on Dashboard Designer as I show at the bottom of the post. Are you seeing that you are on at least 14.0.4750.1000 or higher? If not then you have not completed the SP1 install. If you see that then the next thing would be to verify that you are now seeing the Filter Measure option when you create a MDX Query, Member Selection, or Named Set type of filter. If you are seeing that then you should be good to go. When you create your dashboard page you will be able to connect filters to each other to get the cascading working. Just remember that the limitation is you can only make a single connection, so you can not connect multiple filters to the same filter.
Erika Gil said
Thanks for your response.
Indee I verify the build number on PPS Designer, appears 14.0.4750.1000, but I don’t see the Filter Measure option when I create the filters, any idea?
denglishbi said
Well you should definitely see that option if you are using a filter type that is going against a multidimensional data source. Is that what you are trying to do? What type of measure are you trying to create? Have you tried to open up one of your existing filters in Dashboard Designer and do you see the Filter Measure setting for those? If you are still experiencing issues you might want to post a thread over in the forums here – http://social.technet.microsoft.com/Forums/en-US/ppsmonitoringandanalytics/threads
Erika Gil said
Yes, I’m creating a filter against a multidemensional data source, but I don’t see the Filter Measure option when I’m creating the filter and as far it concers with the existing filters this option doesn’t appear at all, because all of them where created from scratch and I’ve never seen that Filter Measure Option. After we applied the package still doesn’t appear.
Finally our SP server 2010 is virtualized over HV. Is this something that could affect the perform of PPS services?
Thanks for you suggestion, I will do that.
An open letter to Microsoft – BI challenges. « MarkGStacey said
[…] https://denglishbi.wordpress.com/2011/06/29/performancepoint-2010-cascading-apply-filters-sp1-feature… […]
Todd B said
Hi Dan – I’m using a Connection to pass the member row: member unique values from a PerformancePoint scorecard that has a Product Hierarchy member, with the subsequent machine hierarchy members indented below it that make that product, to a PerformancePoint report that houses an SSRS report which takes the member row member unique values as a parameter input to display details for that machine within the SSRS report.
Clicking on the individual Machine Hierarchy rows in the scorecard passes the correct Machine hierarchy values, but when I click on the Product hierarchy row in the scorecard, the SSRS report abends because that’s not a valid machine hierarchy value. When the Product Hierarchy row is selected, what I would like to pass in is the machine hierarchy “All” member, ie override the <> moniker in the connection with “[Machine].[Machine Hierarchy].[All]”.
I’ve added the following in the Connection Formula editor, and it works correctly for the children rows (the else clause) but when clicking on the Product hiearchy row, the Machine Hierarchy “all” substitution is not working.
IIF (<> = “Product One Product”, [Machine].[Machine Hierarchy].[All], <> )
Any ideas on how to override <> within the Connection Formula Editor?
Thanks much for any input you might have!
Todd B
Todd B said
“<>” (no spaces) translated to in the post above
Todd B said
Let’s try this: < >
Todd B said
ok. open bracket open bracket UniqueName close bracket close bracket < >
Dave said
I have a question, and it could that I’m just new at this and so making an error, but in my second filter because I have the All category in it, it overides and pulls in the data from everyone irregardless of what I enter in the first paramter. E.G. total from USA when I select Texas. Is there a way to control the all category so that if select it shows everything relevent to Texas only?
kpsheridan@verizon.net said
Hey Dan, great post – you certainly seem to be providing a lot of value to folks. Hopefully me as well. I’m trying to do a simple main category / category / index name cascading filter, and the filters work terrific independently when used against an analytic grid, but when I try to filter the category based on the main category, I get the following message: “Unable to get filter values from “IDR Select Category”.You do not have permission to view this data.” It’s a 20700 error according to the server, but everything I’ve tried including unattended accounts, regenerating keys, nothing changes it. Is there a “use cascading filters” permission I need to set?
Thanks again!
denglishbi said
I would double check the data source that is being referenced. Verify that it is pointing to the right server and check that a cube has been selected in the drop down list.
Nemo said
Hi,
I have a hierarchy A->B–>C in my cube,
I have created three cascading filters using this hierarchy in PPS dashboard designer. I want to connect all the three filters to an analytic chart. But when I keep the Hierarchy A-B-C in the background of the chart ,I am able to connect it to just one filter at a time.
But I want that if any of the three filters are changed the report should be updated. How can I achieve this??
Is there some connection formula that needs to be added?? If so, a sample example would be most appreciated.